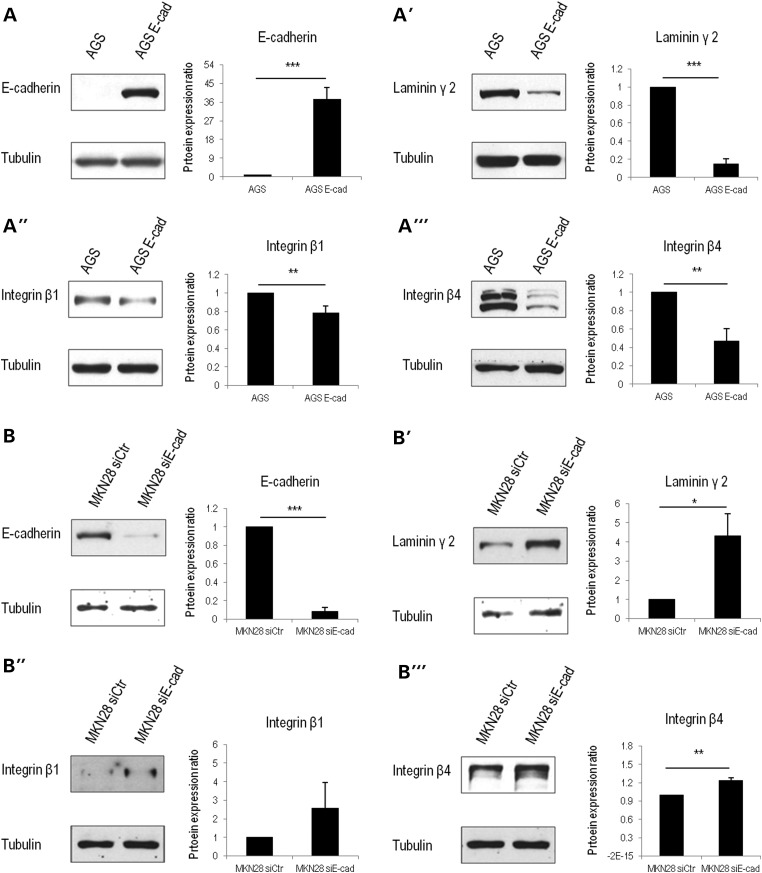
Figure 2.
Ecad+ versus Ecad– human gastric cancer cells in vitro. (AA‴) By analysing cell lysates, we observe that AGS cells negative for Ecad (A) express higher levels of LM-γ2 (A′), as well as integrin β1 (A″) and β4 (A‴). (B–B‴) In an Ecad inhibition model, Ecad-defective MKN28 cells (B) express higher levels of LM-γ2 (B′), integrin β1 (B″) and integrin β4 (B″) than those transfected with a non-targeting siRNA control. Graphs correspond to the average of protein expression levels obtained by band quantification. SE is represented as the error bar. Values were normalized to tubulin and to the respective control (AGS parental cells or MKN28 siCtr). (*) stands for P ≤ 0.05, (**) for P ≤ 0.01 and (***) for P ≤ 0.001.

