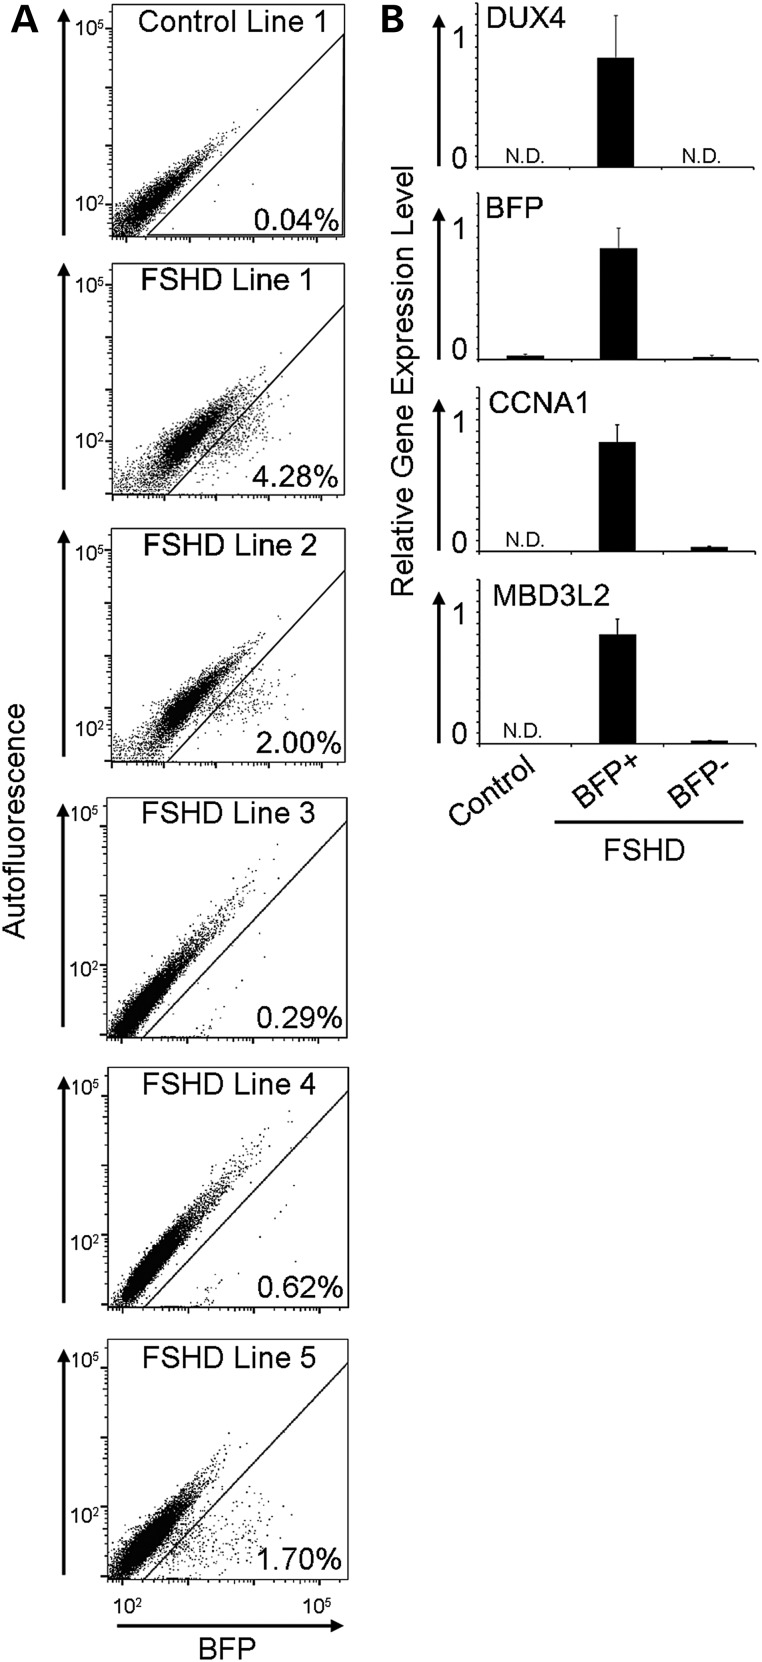
Figure 4.
Quantification of DUX4 activation events and DUX4 and DUX4 target mRNA expression analysis in sorted myoblasts. (A) Representative flow cytometry plots of BFP fluorescence intensity (X-axis) versus autofluorescence (Y-axis) in 72 h differentiated control and FSHD myoblasts harboring the DUX4-activated BFP reporter with % reporter + cells displayed for each line. (B) Populations of BFP+ and BFP– myoblasts were collected by flow sorting and mRNA levels of DUX4, and DUX4 targets BFP, CCNA1 and MBD3L2 were measured by qRT-PCR. (N.D., not detected).

