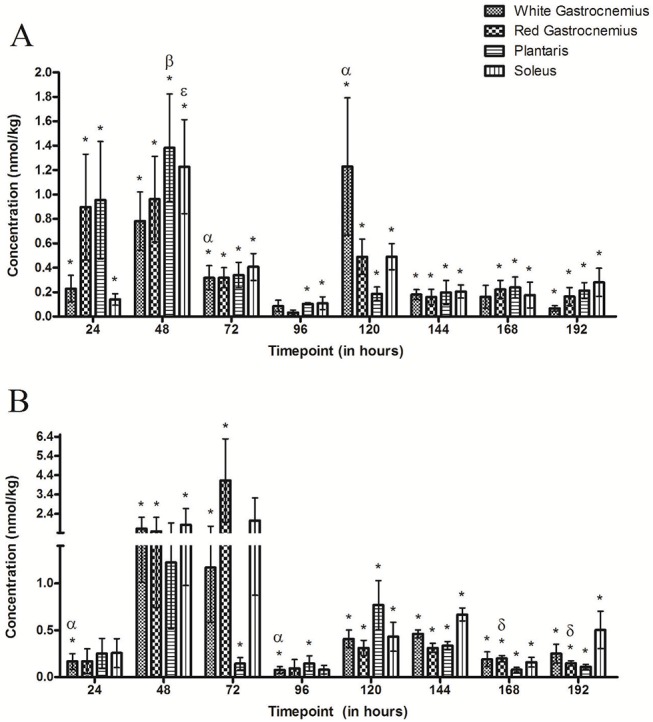
Fig 2. Doxorubicin concentrations in skeletal muscle groups following the IP administration of (A) 1.5 mg kg-1 or (B) 4.5 mg kg-1 of Doxorubicin.

(A) * Denotes significance when compared to baseline for all muscle groups. α Indicates the highest points of accumulation of DOX (P<0.05) in the white gastrocnemius, β Indicates the highest point of accumulation (P<0.05) in the plantaris and ε Indicates the point of greatest accumulation of DOX (P<0.05) in the soleus. (B) * Denotes significance when compared to baseline for all muscle groups. α Denotes a decrease (P<0.05) compared to 48 hours in the white gastrocnemius and δ denotes a significant decrease compared to 72 hours in the red gastrocnemius. There are no significant differences between muscle types at any time point in either administered doses.
