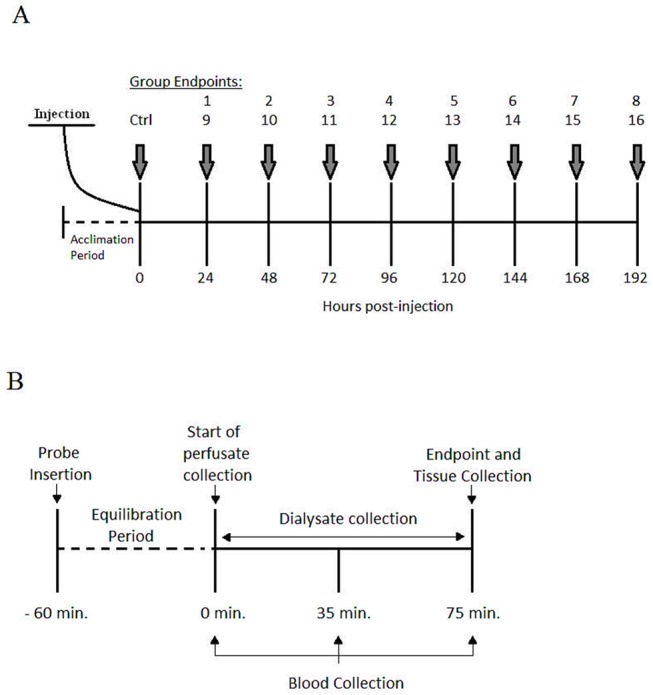
Fig 5. Organization of experimental groups and experimental procedures.

(A) Schematic representation of the experimental groups receiving an injection of 1.5 mg kg-1 dose (groups 1–8) or 4.5 mg kg-1 (groups 9–16) of DOX IP. A sham injection is administered to the control group (Ctrl). (B) Representation of the experimental proceedings for dialysate, blood and tissue collection following microdialysis probe insertion and carotid artery cannulation.
