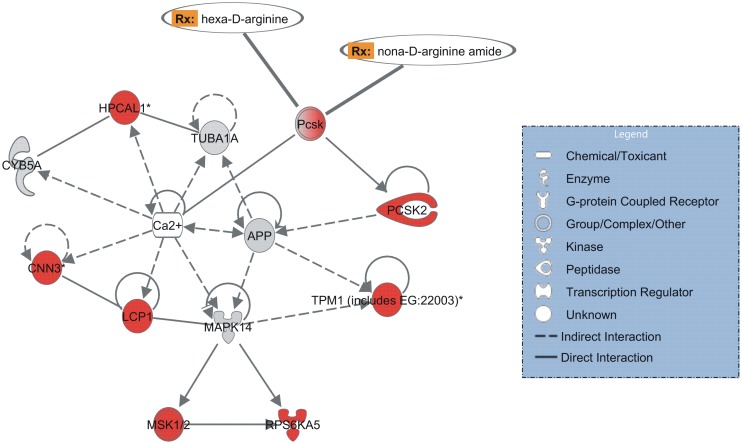
Fig 4. Enriched gene interaction network detected with similar expression pattern in PZQ-treated paired males and females.
The gene interaction network is related to carbohydrate metabolism, molecular transport and small molecule biochemistry. The shapes of elements correspond to different types of molecules, as indicated in the inset box. Arrows indicate the relationship between the elements: dashed or solid lines indicate indirect or direct interactions, respectively. The color intensity is proportional to expression value, computed as log2 [PZQ/Control]; red corresponds to positive log-ratios, i.e. genes up-regulated in paired males and females treated with PZQ when compared with their respective no-drug controls, grey corresponds to those genes present in the analysis but not differentially expressed. In humans, one gene homolog in this network encodes a protein that is a known drug target and the corresponding drugs (Rx) are indicated.

