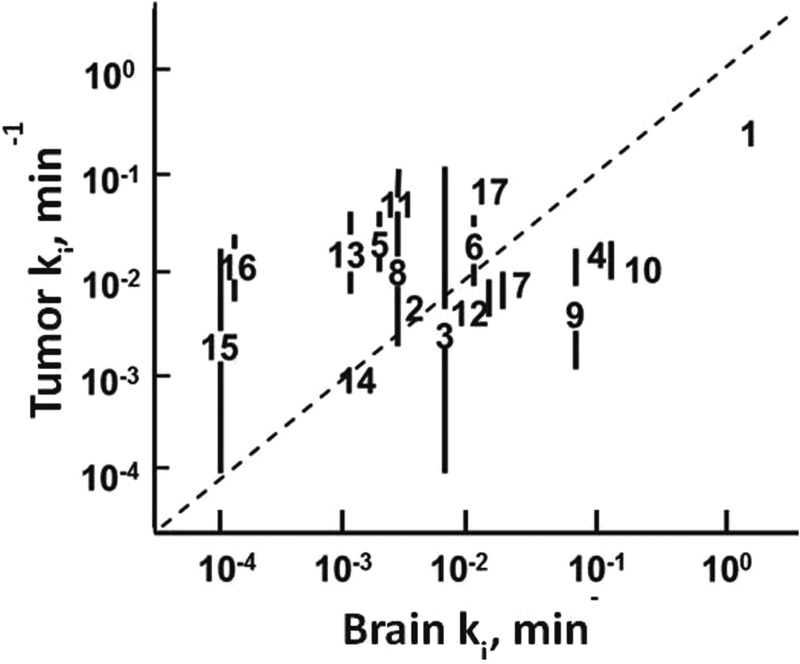
Fig. 6.
This plot depicts the the relationship of the transfer constant ki, permeability × surface area, for i.c. rat 9 L tumor vs normal mouse brain200,201 and temozolomide from a human study.201 The dashed line has slope of unity and is not fit of that data. 1, 3HOH; 2, NaCl; 3, urea; 4, glycerol; 5, creatinine; 6, 5-fluorouracil; 7, dianhydrogalactitol; 8, galactitol; 9, misonidazole; 10, procarbazine; 11, α-difluoromethylornithine; 12, dibromodulcitol; 13, sucrose; 14, epipodophyllotoxin; 15, bleomycin; 16, inulin; and 17, temozolomide.

