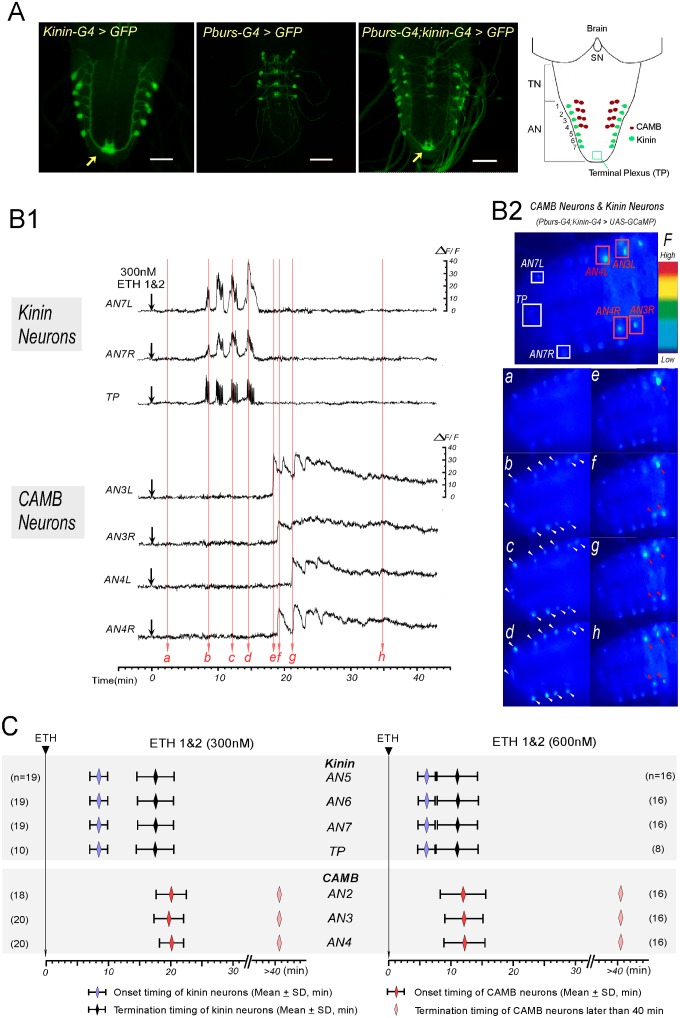
Fig 2. ETH evokes sequential activation of kinin and CAMB neurons.
(A) Immunohistochemical staining to verify Gal4 expression in both kinin and CAMB neurons (Scale bars = 50μm). Kinin neurons (Kinin-Gal4, far left), CAMB neurons (Pburs-Gal4, left), and double Gal4 (right) were labeled by GFP using pbur-Gal4, kinin-Gal4 or pburs;kinin combination Gal4 and UAS-GFP. Far right: Schematic diagram showing relative position of CAMB neurons (AN1-4) and kinin neurons (AN 1–7). Note that kinin neurons project axons to a terminal plexus (TP, neuropil) in AN9 (arrow). Kinin neurons project axons posteriorly to TP and then turn anteriorly along the ventral midline. SN: subesophageal neuromeres; TN: thoracic neuromeres; AN: Abdominal neuromeres. (B) Ca2+ dynamics in kinin and CAMB neurons by ETH. (B1) Representative recordings of intracellular Ca2+ dynamics in kinin neurons (AN7, TP) and CAMB (AN3, 4) following exposure to ETH 1 & 2 (300 nM each) applied at time 0 (downward arrows). Following ETH application, kinin cell bodies in AN 7 and TP show robust and highly synchronized calcium oscillations after characteristic delays. CAMB neurons become active shortly after termination of kinin neuron activity. (B2) Video image shows locations of cell bodies and TP where Ca2+ dynamics were recorded (Top). Time-lapse video images captured during Ca2+ responses (bottom): timing of video image recordings (a-h) are indicated by vertical arrows in B1 (faint red). (C) Onset and termination of Ca2+ responses in kinin and CAMB neurons induced by ETH 1 & 2. Upon exposure to ETH1 and ETH2 (300 nM each; left), kinin and CAMB neurons are activated sequentially at 8.5 min and 20.0 min respectively. Doubling ETH concentration (600 nM each of ETH1 and ETH2, right) accelerates kinin and CAMB neuron activation, but sequential activity is maintained (6.0 min and 12.0 min respectively). Note that CAMB neuron activity lasts more than 40 min.

