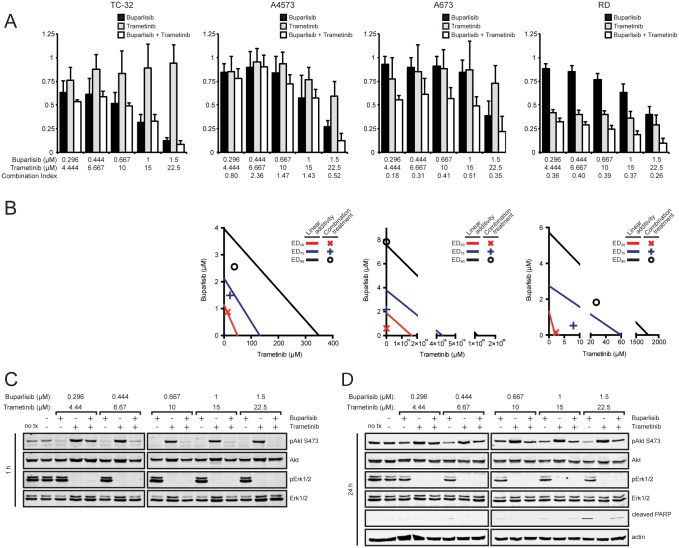
Fig 8. Buparlisib synergizes with trametinib in cell lines harboring MAPK pathway mutations.
(A) Cell lines with (A673, RD) and without (TC-32, A4573) MAPK pathway mutations were exposed to a series of 1.5-fold dilutions of buparlisib and trametinib alone or in combination at a constant ratio of 1:15 for 72 hours, then cell viability was determined by MTT assay. Columns represent the average of three independent experiments, error bars represent standard deviation. Combination index values greater than 1, equal to 1, or less than one indicate antagonism, additivity, or synergy. (B) Isobologram plot of the effect of buparlisib combined with trametinib. The effective doses of trametinib and buparlisib are plotted on the x- and y-axis, respectively. Points for combination treatment above, on, or below the lines indicate antagonism, additivity, or synergy with lines of linear additivity connecting the ED50, ED75, and E90 for individual treatments. Isobologram could not be generated for TC-32 cells since no tramenitib cytotoxicity was observed. (C) Immunoblot analysis of phospho-Akt (S473), total Akt, phospho-Erk1/2 (T202/204, T185/187), and total Erk1/2 in A673 cells after 1 hour of treatment with buparlisib, trametinib, or both. (D) Immunoblot analysis of phospho-Akt (S473), total Akt, phospho-Erk1/2 (T202/204 on Erk1, T185/187 on Erk2), total Erk1/2, cleaved PARP, and actin in A673 cells after 24 hours of treatment with buparlisib, trametinib, or both.

