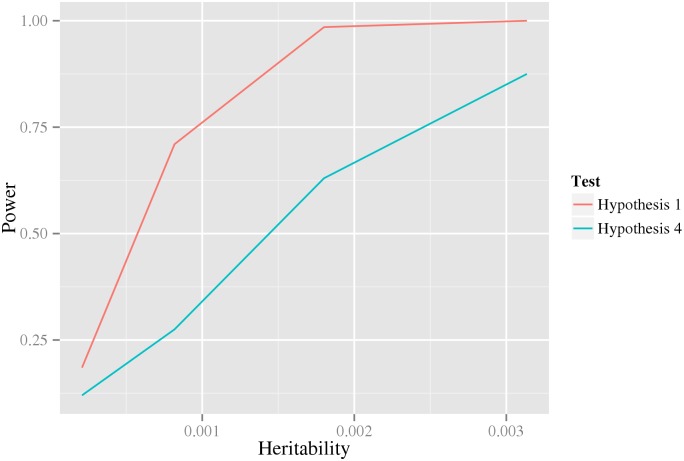
Fig 2. The power of the first and last test under a double dominant interaction model.
The x-axis is the heritability of the model. The y-axis is the statistical power. The colored lines correspond to two different tests: the one performed in the first stage that tests the null hypothesis of no interaction, H 1, (red), and the one performed in the last stage that specifically tests the interaction parameters, H 2, (blue). The logit link function and a nominal significance level of 0.05 was used for the analysis.

