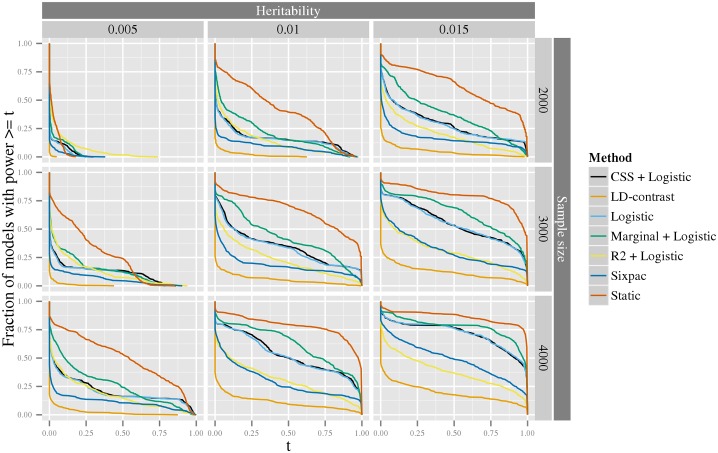
Fig 3. The exceedence distribution of power over all possible interaction models with a specific heritability.
For each plot, the x-axis shows a threshold, t, for power to detect an interaction among 1012 variant pairs, and the corresponding y-axis shows the fraction of models that have a power greater than or equal to t. The rows correspond to the sample size of a balanced design e.g. 2000 indicates 2000 cases and 2000 controls. The columns correspond to the heritability of the models. Six methods for inference of interactions Logistic, Marginal+logistic, CSS+marginal, R2+marginal, LD-contrast, and Sixpac; see text for details), are compared to our static stage-wise scale-invariant method. The line colors used to denote the different methods are shown in the legend to the right.

