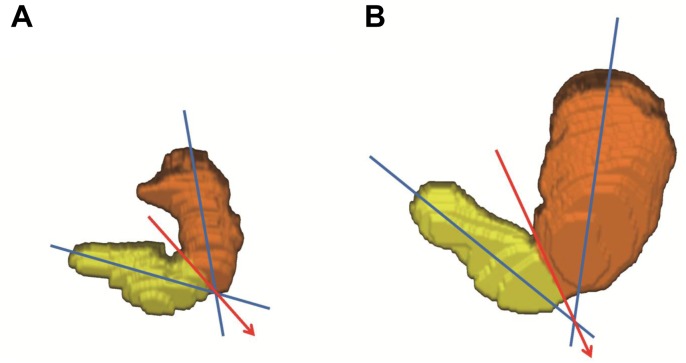
Fig 3. Three-dimensional visualization of stomach volumes measured by MRI before (A) and after (B) ingesting the test meal.
The stomach was divided into the proximal (orange) and distal stomach (yellow) by an imaginary line (red arrow) drawn from the angular incisures to the point of contact between the 2 longitudinal axes (blue lines) through the center of the upper and lower parts of the stomach. The DA-9701 group case showed an increase in proximal to distal TGV ratio from 1.88 to 4.50 15 min after the test meal.

