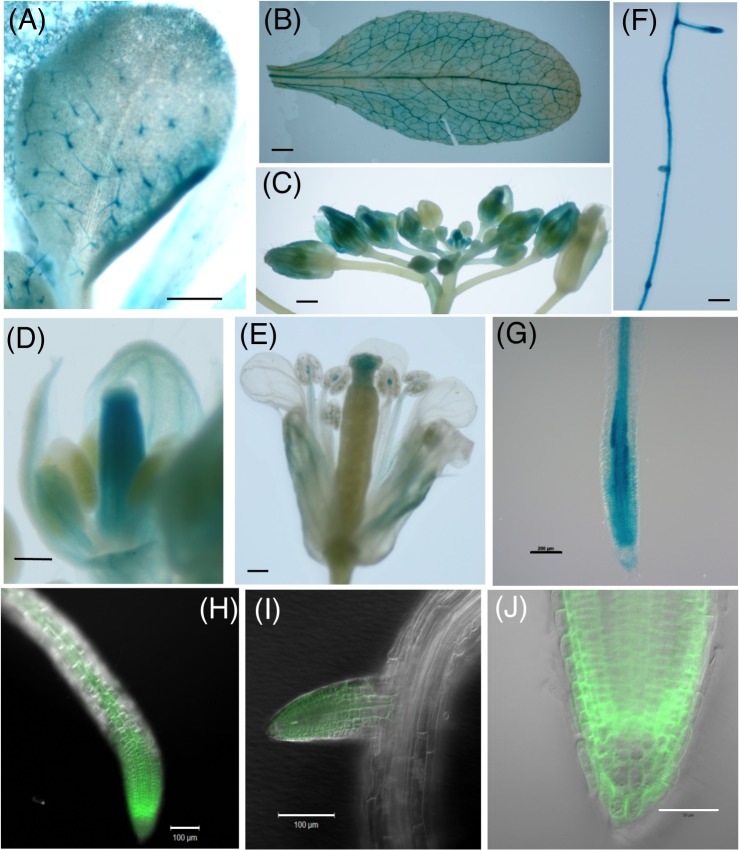
Fig 4. Tissue expression of AtPLC2.
(A-G) Tissue expression of AtPLC2 by histochemical GUS staining of ProPLC2:PLC2-GUS transgenic plants. (A) Developing rosette leaf of a 7-day-old seedling, (B) developed rosette leaf of a 3-week-old plant, (C) inflorescence with floral buds in different developmental stages, (D) floral bud with developing reproductive organs, (E) mature flower, (F) part of the main root of a 2-week-old seedling and (G) tip of the main root of a 2-week-old seedling. (H-J) Localization of fluorescent PLC2-Venus in roots of 2-week-old seedlings of ProPLC2:PLC2-Venus transgenic plants. (H) Main root, (I) emerging lateral root branch, (J) tip of the main root. Scale bars are 500 μm in (A) to (C), 200 μm in (D) to (G), 100 μm in (H) and (I) and 50 μm in (J).

