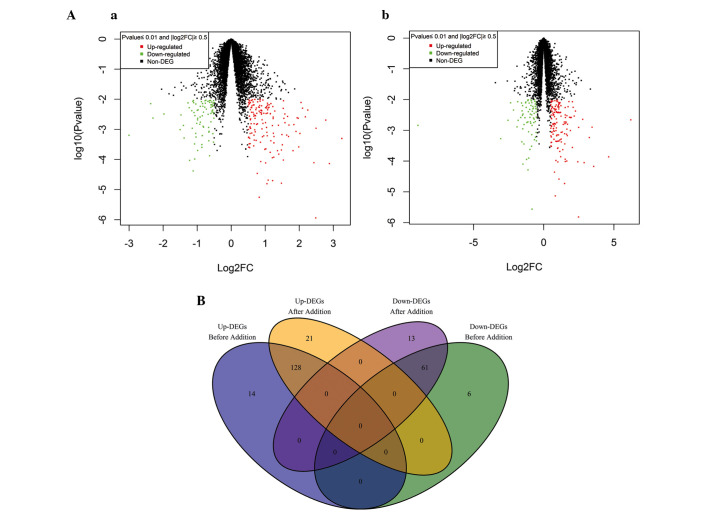
Figure 1.
Gene expression analysis pre- and post-summation. (A) Scatter diagram of the gene expressing profiles (Aa) pre- and (Ab) post-summation. The log2FC value is on the x-axis and log10 (P-value) is on the y-axis. (B) Comparison between the number of genes pre- and post-summation. DEGs, differentially expressed genes; FC, fold-change; Up-DEGs, upregulated DEGs; Down-DEGs, downregulated DEGs.

