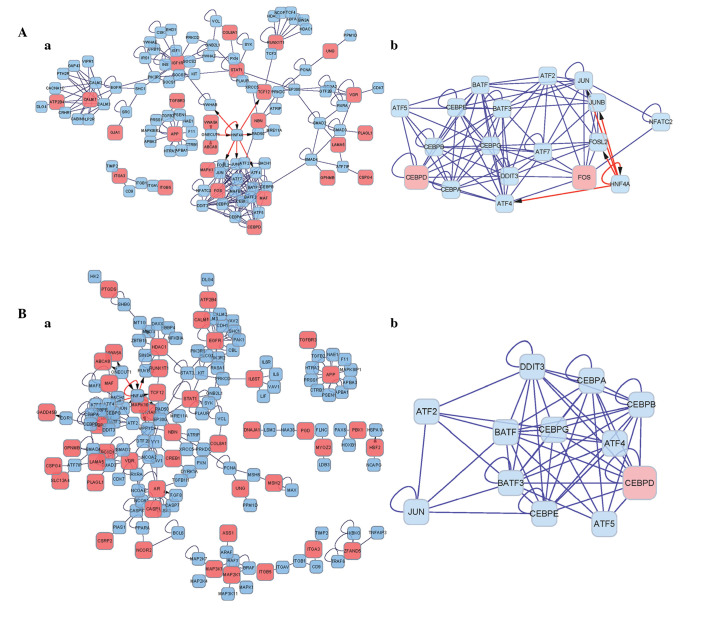
Figure 2.
Interaction networks of the DEGs. (A) Pre-summation network; (Aa) whole network; (Ab) most significant subnetwork. (B) post-summation network; (Ba) whole network; (Bb) most significant subnetwork. Pink nodes represent DEGs; blue nodes represent their interaction genes. Red arrows indicate the interaction between protein and DNA, blue lines indicate interaction between proteins. DEGs, differentially expressed genes.

