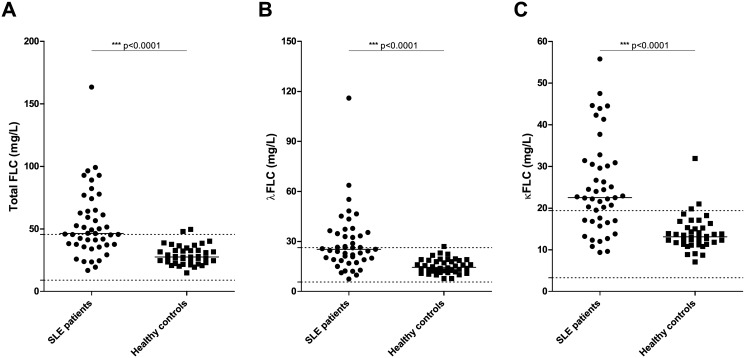
Fig 1. Concentration of serum FLCs in SLE patients and healthy controls.
Total FLC (A), λFLC (B) and κFLC (C) levels in SLE patients (n = 45) and healthy controls (n = 40) measured by quantitative nephelometry. SLE patients suffering from renal insufficiency (eGFR<60 ml/min/1.73m2) were excluded. Middle horizontal bars represent median and statistical significant differences are indicated with *, ** or *** for p-values less than 0.05, 0.01 or 0.001. p-values for comparison of FLC levels in SLE patients and healthy controls are <0.0001. Maximum and minimum values of the normal ranges of λFLCs and κFLCs are indicated on the y-axis as dotted lines. FLCs—free light chains, SLE—systemic lupus erythematosus.

