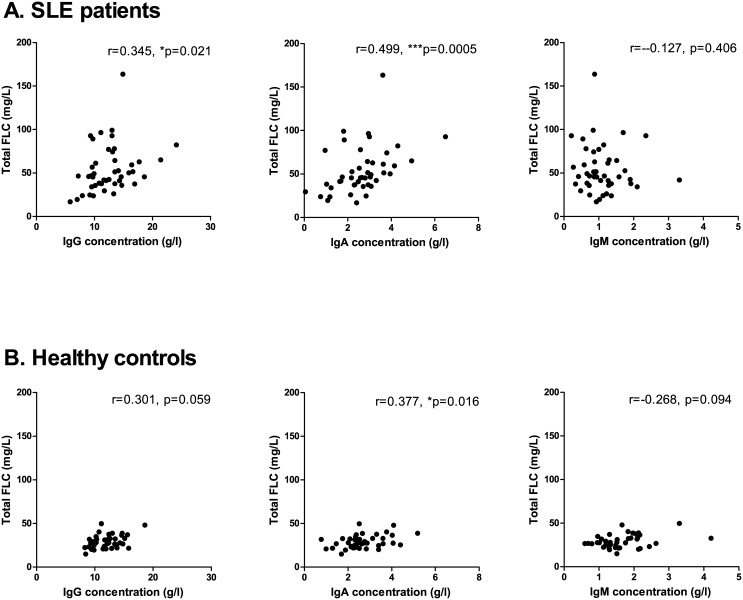
Fig 5. Correlation between serum FLC concentrations and total immunoglobulin levels.
Correlation between total immunoglobulin levels and total FLC, λFLC and κFLC levels in SLE patients (A) (n = 45) and healthy controls (B) (n = 40) A: SLE patients. r-values are 0.345 (p = 0.021), 0.499 (p = 0.0005) and -0.127 (p = 0.406) regarding total FLC, λFLC and κFLC levels, respectively. B: Healthy controls. r-values are 0.301 (p = 0.059), 0.377 (p = 0.016) and -0.268 (p = 0.094) regarding total FLC, λFLC and κFLC levels, respectively. FLCs—free light chains, SLE—systemic lupus erythematosus.

