
Figure 1.
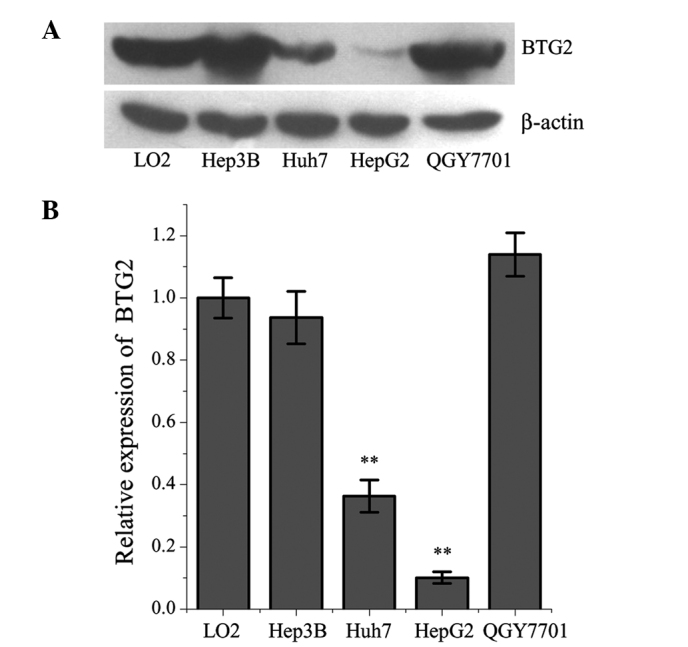
Protein expression levels of BTG2 in the Hep3B, Huh-7, QGY-7701 and HepG2 liver cancer cell lines and in L02 normal liver cells. (A) Representative western blots. (B) Quantitative analysis of three experiments. **P<0.01, compared with the L02 cells. Data are presented as the mean ± standard deviation. BTG2, B-cell translocation gene 2.