
Figure 4.
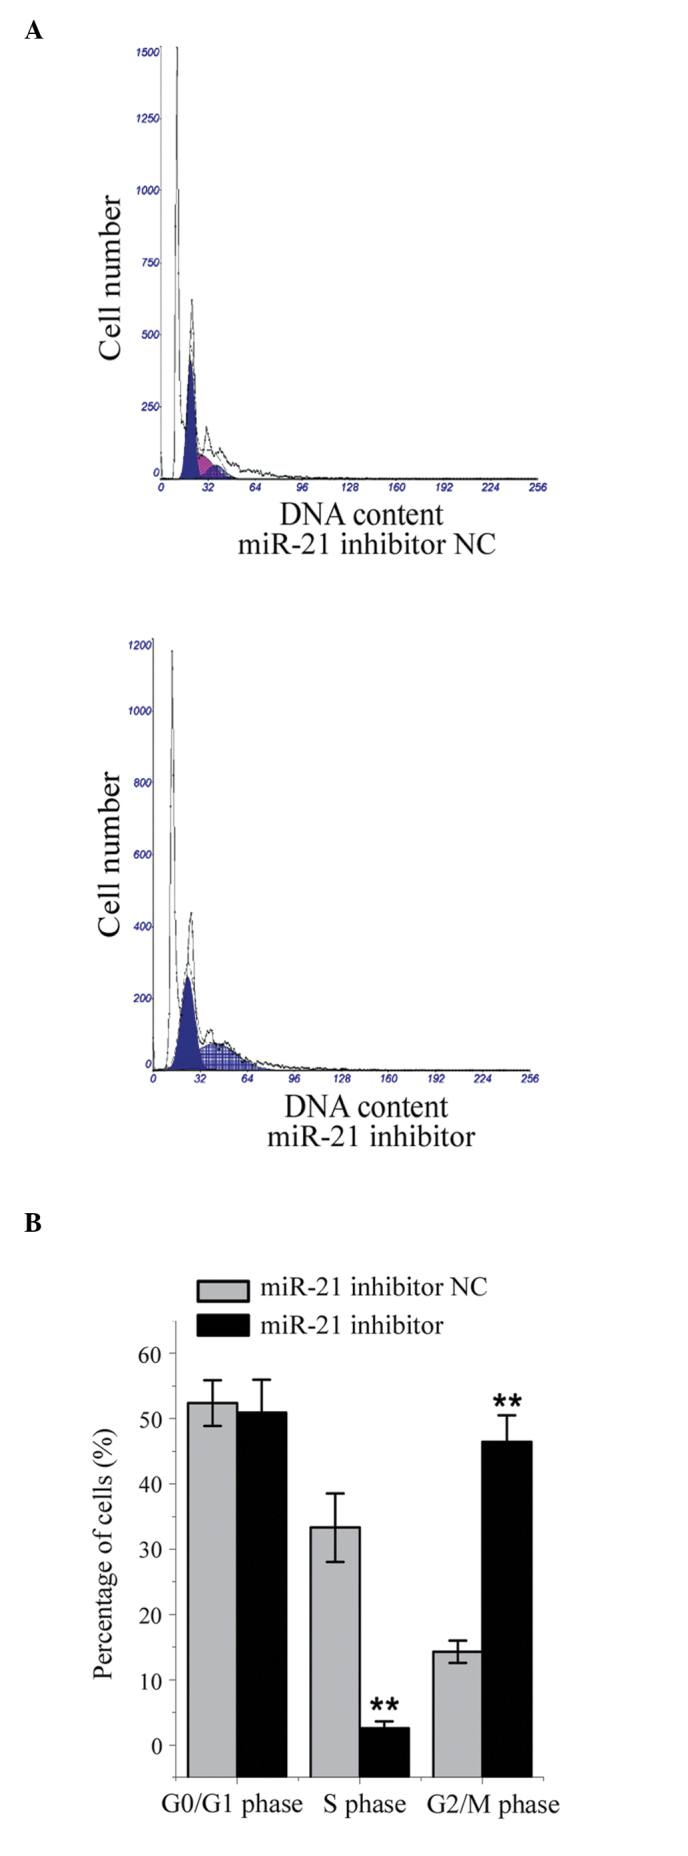
Effects of miR-21 inhibition on the cell cycle distribution of HepG2 liver cancer cells. (A) Representative data of the flow cytometric analysis; (B) Mean percentages of cells in each phase of the cell cycle. **P<0.01, compared with the NC-transfected cells. Data are presented as the mean ± standard deviation. miR-21, microRNA-21; NC, negative control.