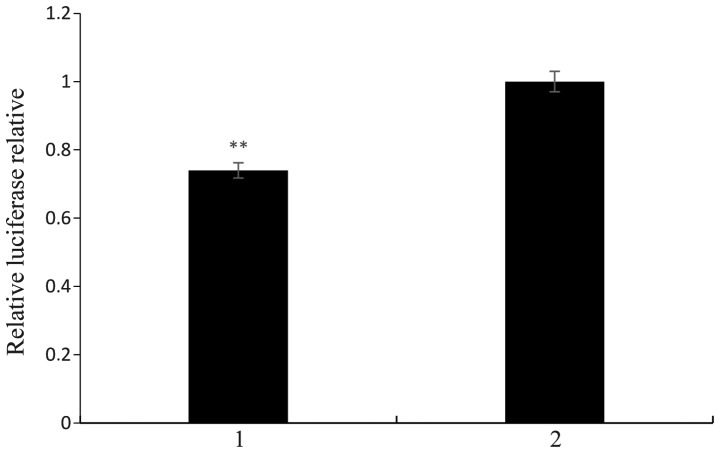
Figure 15.
Identification of miR-26b target sites in EphA2. 1 represents EphA2 and 3′-UTR pmirGLO and the miR-26b mimics co-transfected HeLa cells. 2 represents EphA2 3′-UTR pmirGLO and negative control co-transfected Hela cells. Values are expressed as the mean ± standard error (n=3). **P<0.01. UTR, untranslated region; miR, microRNA.

