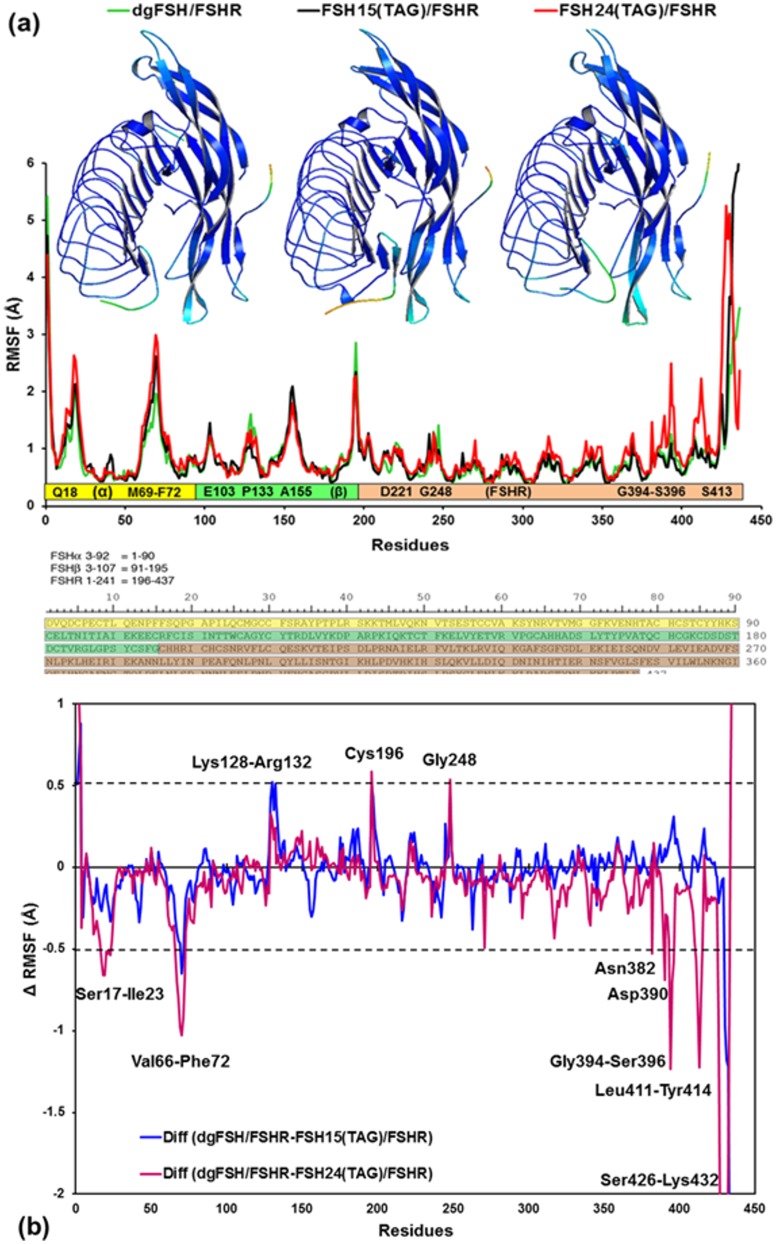
Fig 8.
(a) Plot showing RMSF values of Cα atoms from MD simulations of dgFSH / FSH24(TAG) (in green), FSH15(TAG) (in black), and FSH24(TAG) (in red). Residues associated with the RMSF, showing each subunit as a bar (α-subunit: yellow bar, β-subunit: green bar and FSHR: light-orange bar) and single-letter code sequences with residue numbers for the regions where RMSF changes reasonably. Residue sequences with reasonable RMSF changes of at least >1.0 Å are labeled inside the bars in each subunit. Ribbon models: Color-coded mapping of the averaged protein flexibility profiles (RMSF values) from MD simulations of the dgFSH, FSH15(TAG) and FSH24(TAG) FSH-FSHR complexes (from left to right). The color-coded sliding scheme is the same as was adopted for Fig 6a. The amino acid sequences for FSHα residues 3–92 (yellow), FSHβ 3–107 (green), and FSHR 1–241 (brown) are shown below. (b) Difference of RMSF values for FSH15(TAG) and FSH24(TAG) from dgFSH. The residues with absolute difference larger than 0.50 Å are labeled by two cutoff dashed black lines.

