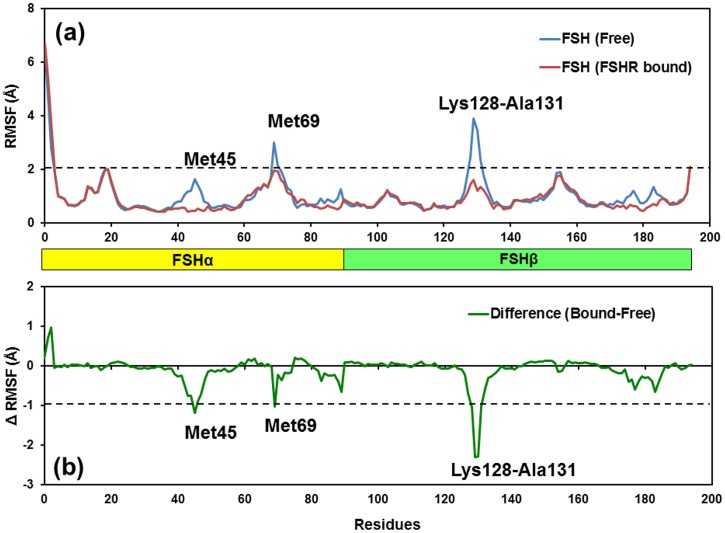
Fig 9.
(a) Plot showing RMSF values of Cα atoms from MD simulations of free/unbound FSH and FSHr-bound models of FSH. RMSF changes were noted in two regions in the FSHα subunit centered on residues Met45 and Met69 and one region in the FSHβ subunit centered on residues Lys128-Ala131. Residues with RMSF changes of at least >2.0 Å are labeled inside the bars in each subunit. (b) Difference of RMSF values for FSHR-bound FSH and free-FSH models. The residues with absolute difference larger than 1.0 Å are labeled by one cutoff dashed black line.

