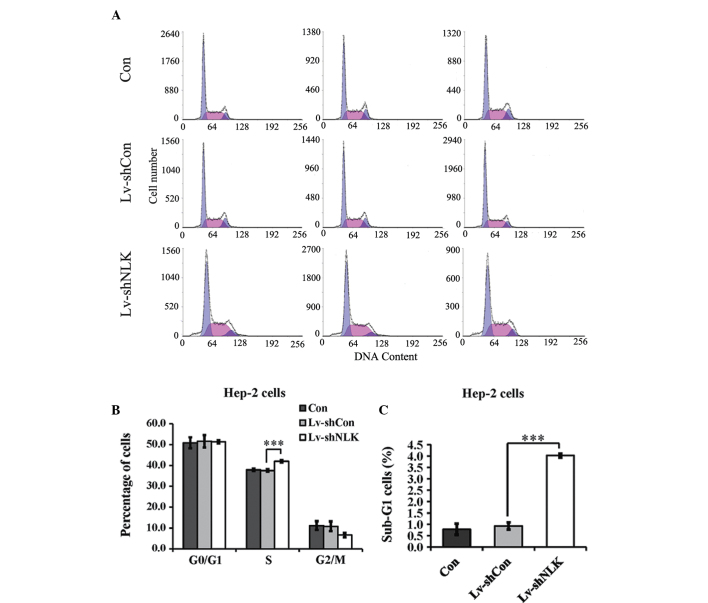
Figure 3.
Effects of NLK on the cell cycle and cell apoptosis determined by flow cytometric analysis. (A) Histograms showing the cell cycle distribution of uninfected Hep-2 cells (Con) and cells infected with the Lv-shNLK and Lv-shCon. (B) Suppression of NLK expression by RNA interference resulted in an increase in the percentage of cells in the S phase. (C) A significant increase was identified in the percentage of cells in the sub-G1 phase following transfection with NLK siRNA. The percentage of cells in each phase of the cycle is presented as the mean ± standard error of three independent experiments. NLK, nemo-like kinase.

