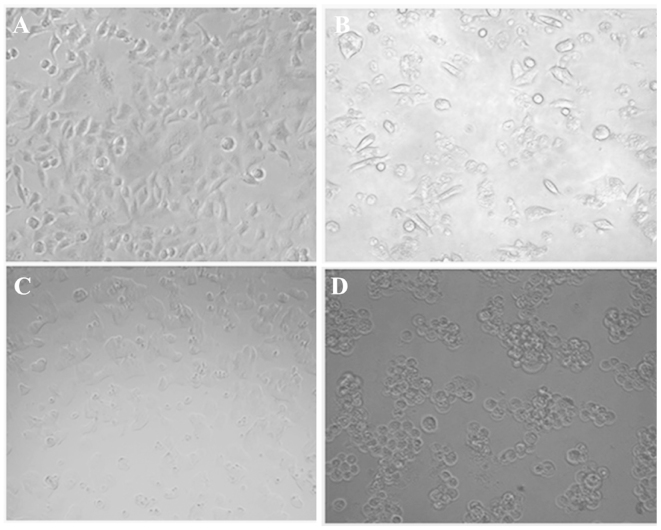
Figure 5.
Analysis of morphological changes in oleanolic acid-treated HepG2 tumor cells. (A) Untreated HepG2 control cells. (B–D) HepG2 cells treated with 5, 25 and 50 µM oleanolic acid, respectively. Cells were exposed to various concentrations of oleanolic acid and morphological changes were observed following 48 h of treatment. Images were captured using an inverted microscope (magnification, ×20).

