
Figure 8.
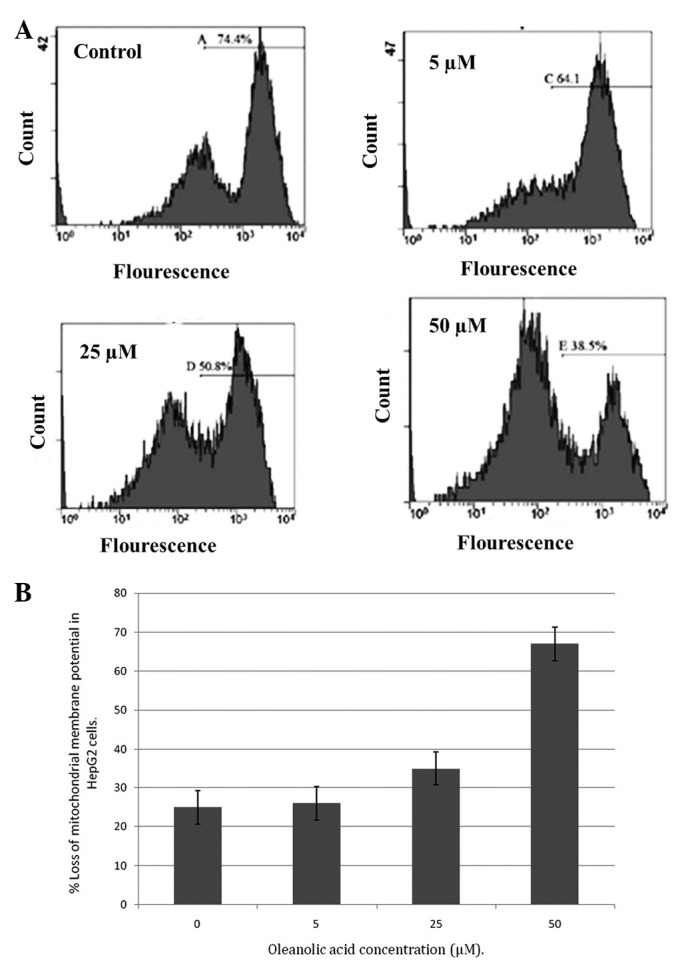
(A) Effect of oleanolic acid on the mitochondrial ΔΨm of HepG2 cells. Cells treated with oleanolic acid for 48 h were incubated with rhodamine-123 and measured using flow cytometry. The percentages of cells in the right section of the histogram indicate the number of ΔΨm-collapsed cells. (B) Percentage loss of ΔΨm in the oleanolic acid-treated cells. ΔΨm, membrane potential.