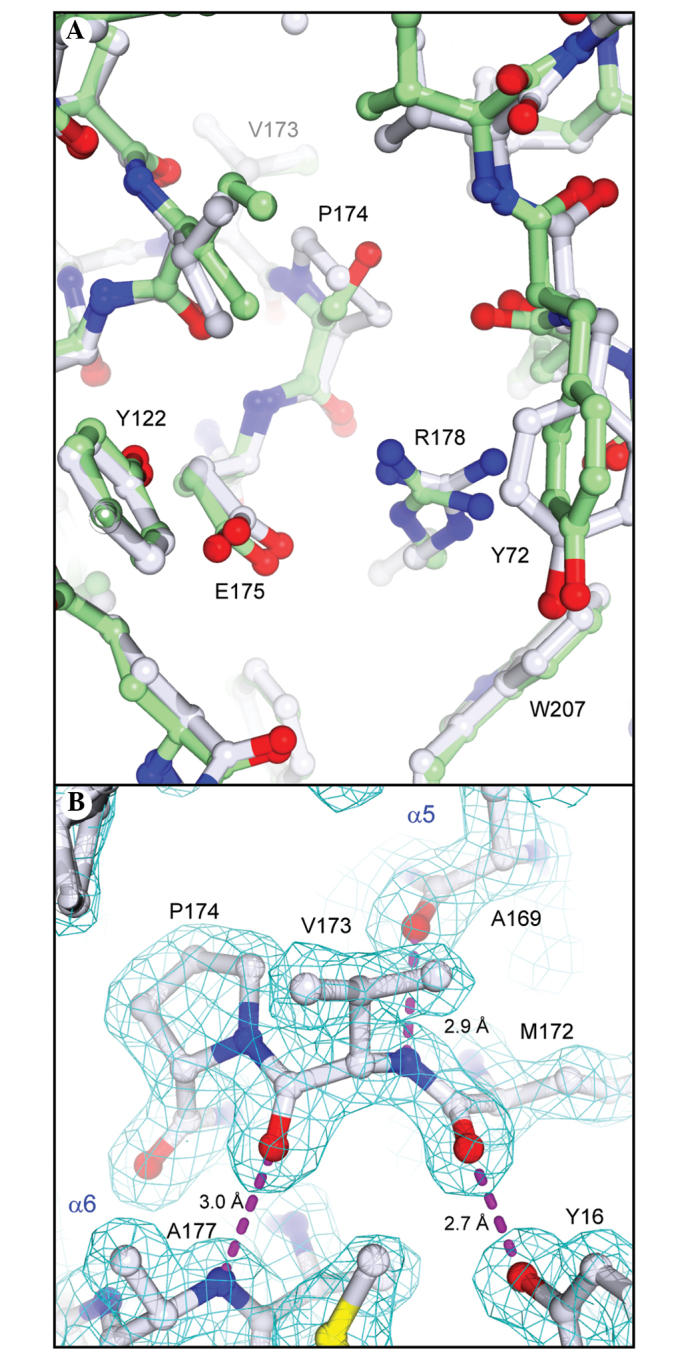
Figure 5.

Active site of PAP-S1aci. (A) Superposition between PAP-S1aci (grey) and PAP-S1 (green; Protein Data Bank code 1gik). Active-site residues for PAP-S1aci are labeled. (B) Electron density features in the vicinity of Val173, a pre-proline Ramachandran outlier according to MolProbity analysis (24). The final model is shown in standard CPK coloring. The final σA-weighted 2Fo-Fc electron density map (cyan; 1.5σ) is overlaid. H-bonds are shown as dashed lines, with corresponding distances between non-hydrogen atoms given in Å.
