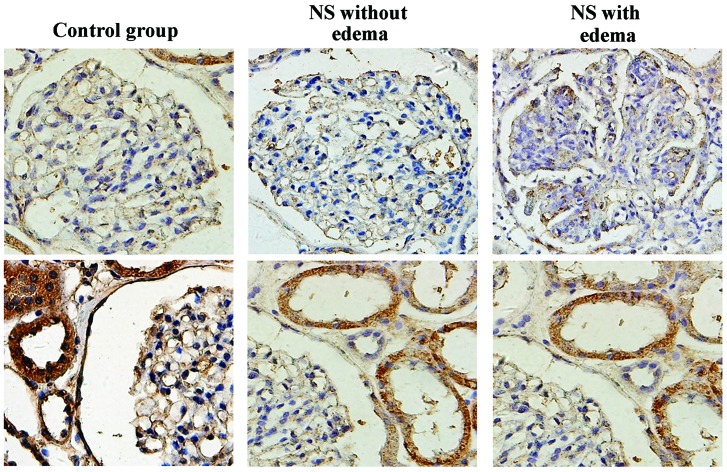
Figure 1.
Expression of AQP1 in kidney tissues in the control, NS without edema and NS with edema groups (magnification, ×400). Representative micrographs in each group demonstrate the immunostaining results for AQP1 in renal tubules (bottom panel) and glomeruli (top panel). AQP, aquaporin; NS, nephrotic syndrome.

