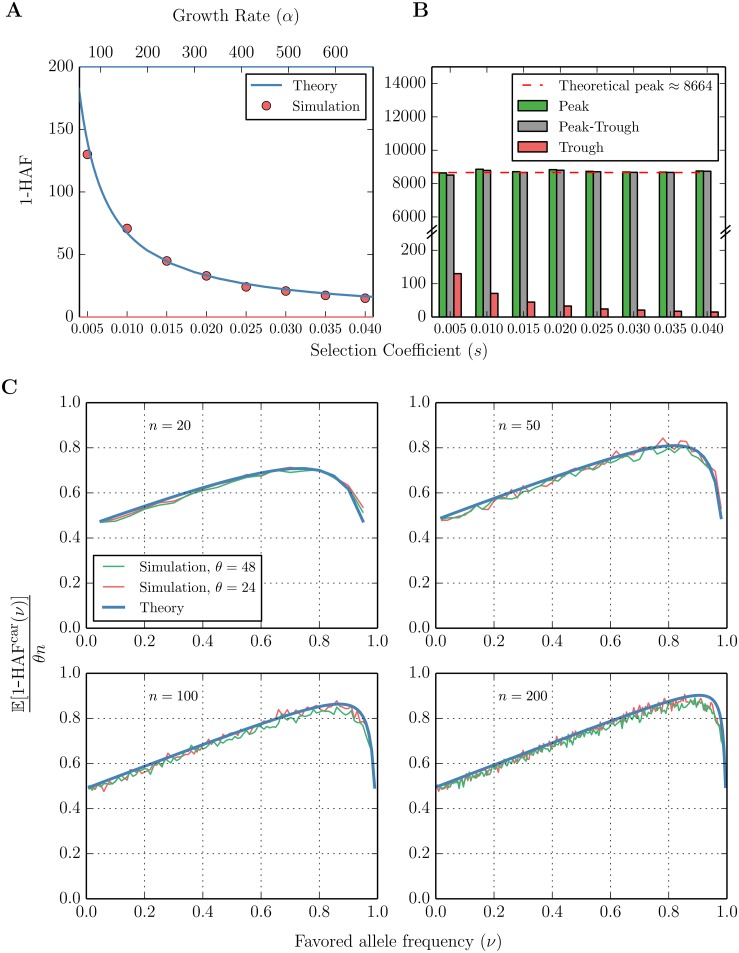
Fig 3. HAF scores in a selective sweep ‘peak’ and ‘trough’.
(A) Observed values (red) of the mean ‘trough’ 1-HAF scores in simulated selective sweeps with coefficients s ∈ [0.005, 0.040]. Theoretical values (blue) of expected 1-HAF scores under exponential population growth with population-scaled rates α ∈ [100, 600] given by Eq (12). Simulated 1-HAF scores (red) represent the mean of 2000 simulated population samples for each value of s, with θ = 48, n = 200. (B) Observed mean 1-HAF peak, trough, and difference (peak minus trough) for selective sweeps with coefficients s ∈ [0.005, 0.040]. The dashed line represents the approximate value of the peak 1-HAF score given by Eq (15). (C) Dynamics of the expected value of 1-HAFcar (1-HAF score of haplotypes carrying the favored allele) plotted as a function of the fraction of carriers (ν) in the sample during a selective sweep. For each (θ, n, ν) with θ ∈ {24, 48}, n ∈ {20, 50, 100, 200}, , s = 0.01, and N = 20000, we plotted the mean value of (1-HAFcar)/(θn) over 1000 trials, and compared against the theoretical values (Eq (13)).

