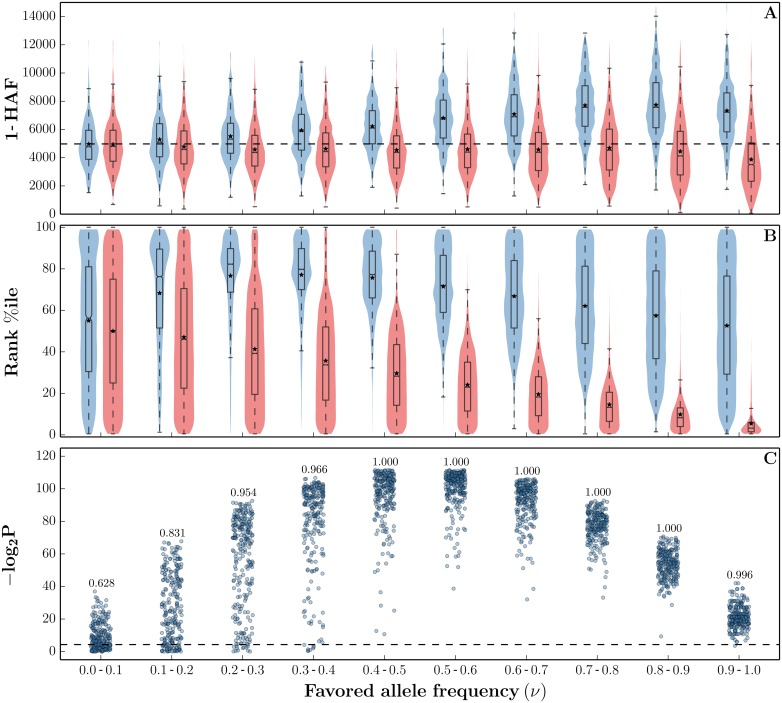
Fig 4. HAF score dynamics in ongoing selective sweeps.
HAF scores were computed from 250 simulated population samples (n = 200) undergoing a hard sweep (θ = 48, ρ = 25, s = 0.01), using the simulation software msms [47]. (A) Each violin shows the Gaussian kernel density estimation (KDE) of 1-HAF scores in carriers (blue) and non-carriers (red) of the favored allele, as the sweep progresses in frequency. A standard box plot is overlaid on each violin to mark the 25th, 50th, and 75th percentiles, with means indicated by asterisks. The horizontal dashed line represents the expected 1-HAF scores under neutrality (Eq (4)). (B) Corresponding violins showing the in-sample percentile rank of 1-HAF scores. (C) −log2(P) values for Wilcoxon rank sum tests rejecting the null hypothesis of identically distributed 1-HAF scores among carriers and non-carriers within each population sample. The number above each bin indicates the fraction of significant tests (where P < 0.05, shown by the dashed line).

