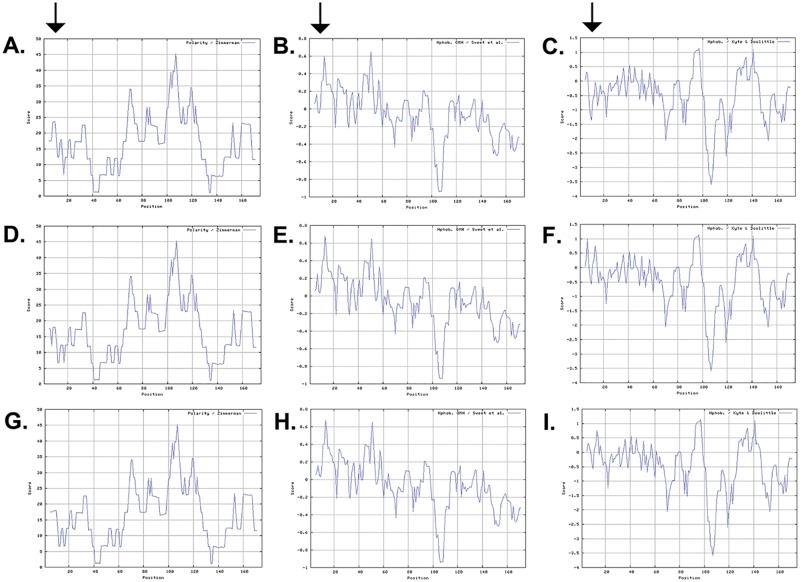
Fig 5. Investigating the physical characteristics of wild-type and mutant CRYAB proteins.
The polarity (A, D, G), the optimized matching hydrophobicity (B, E, H), and hydropathicity (C, F, I) plots of the wild-type and mutant CRYAB proteins. Both mutant proteins (R11C and R12C) revealed low polarity (compare A, with D and G), a higher hydrophobicity (compare B, with E and H), and higher hydropathicity (compare C, with F and I), respectively. The x-axis represents the position of amino acids. The y-axis represents the Polarity, hydrophobicity and Hydropathicity values in a default window size of 9. The arrows point to the difference in their respective polarities (1st arrow from the left), hydrophobicity (2nd arrow from the left) and hydropathicities (3rd arrow from the left).

