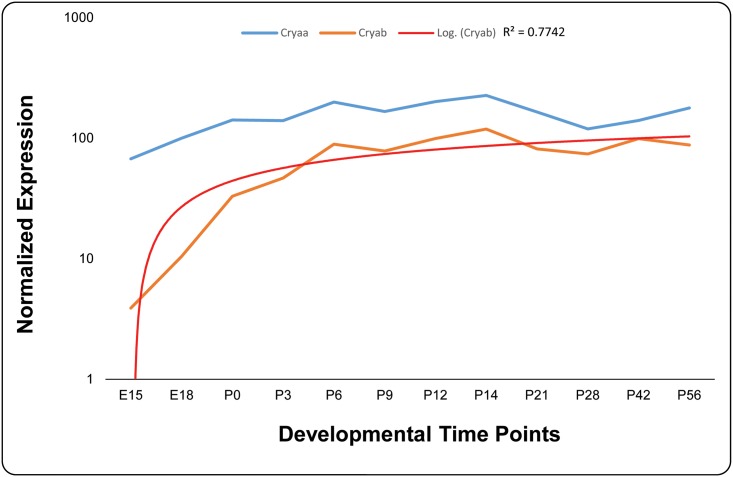
Fig 6. Expression profile of alpha-crystallin in developing mouse lens.
The expression of Cryaa (blue) and Cryab (orange) at different developmental time points was normalized to Gapdh. A logarithmic trend line (red) fits the Cryab expression with an R2 value of 0.7742. The x-axis and y-axis represent developmental time points and normalized expression of each mRNA, respectively.

