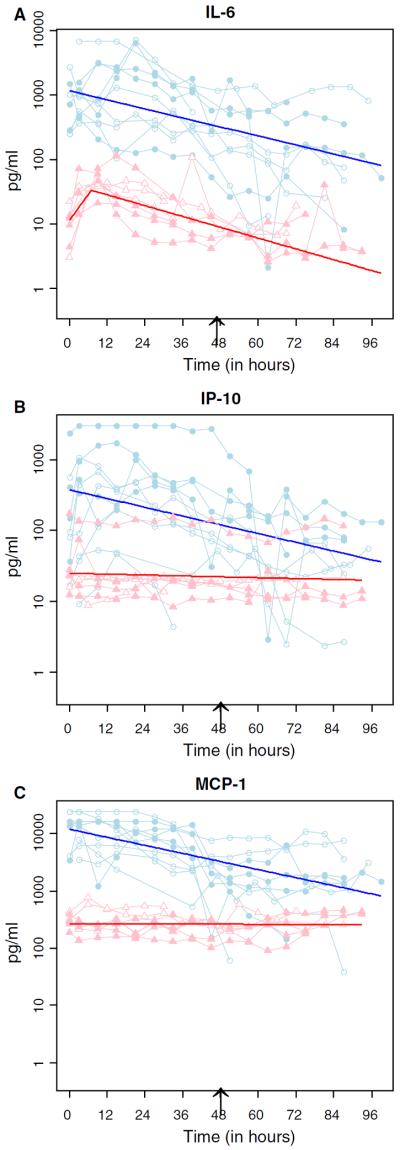
Fig. 1.

Temporal profiles of representative cytokines in brain interstitial fluid and serum. Raw data for IL-6 (a), IP-10 (b), and MCP-1 (c) in brain interstitial fluid (light blue circles) and serum (pink triangles) from each patient in cohort 1 (open circles/triangles) and cohort 2 (filled circles/triangles) were connected by straight line segments. The fitted bold lines (dark blue for brain interstitial fluid and red for serum) were overlaid on the lined scatter plot. The black arrow indicates the time at which cohort two patients were given a single 200 mg dose of temsirolimus. Note that for IL-6 serum data, a piecewise linear regression analysis (joint point at 12 h) was applied to reflect the trend changes (from increasing to decreasing) during the study period
