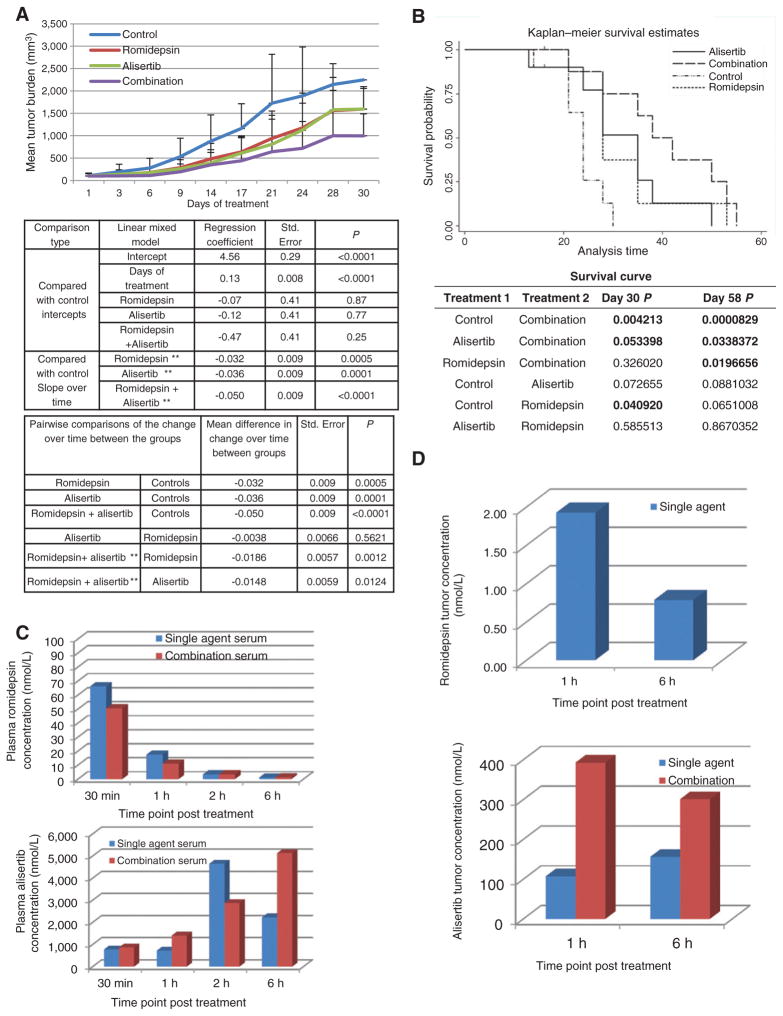
Figure 6.
Alisertib in combination with romidepsin is synergistic in a xenograft model of cutaneous TCL. The HH, TCL cell line was injected into SCID mice. Control mice were injected i.p. with 0.01% DMSO (N = 10). Romidepsin 1 mg/kg was given i.p. day 1, 9, 16 (N = 10). Alisertib 20 mg/kg was given orally once a day from days 1 to 21 (N = 10). Combination mice followed the same treatment schedule as single agents (N = 10). Cycle 1 ended on day 21, and cycle 2 began on day 23, and ended on day 42. A, combination mice showed a statistically significant (P < 0.05) log-transformed tumor burden when compared with the control cohort over time (top table) and single agents over time (bottom table). B, Kaplan–Meier survival curve demonstrates that combination mice surpassed survival of all other cohorts and demonstrates statistical significance when compared with control and single agents (P < 0.05). C, PK analysis on plasma samples was performed following 30 minutes, 1, 2, and 6 hours of treatment. The top histogram depicts romidepsin (R) concentration for all timepoints evaluated whereas bottom histogram depicts the alisertib (A) concentration. D, PK analysis on tumor samples was performed on samples following 1 and 6 hours of treatment. Romidepsin intratumor concentration is depicted in the top histogram whereas alisertib intratumor concentration is depicted in the bottom histogram.

