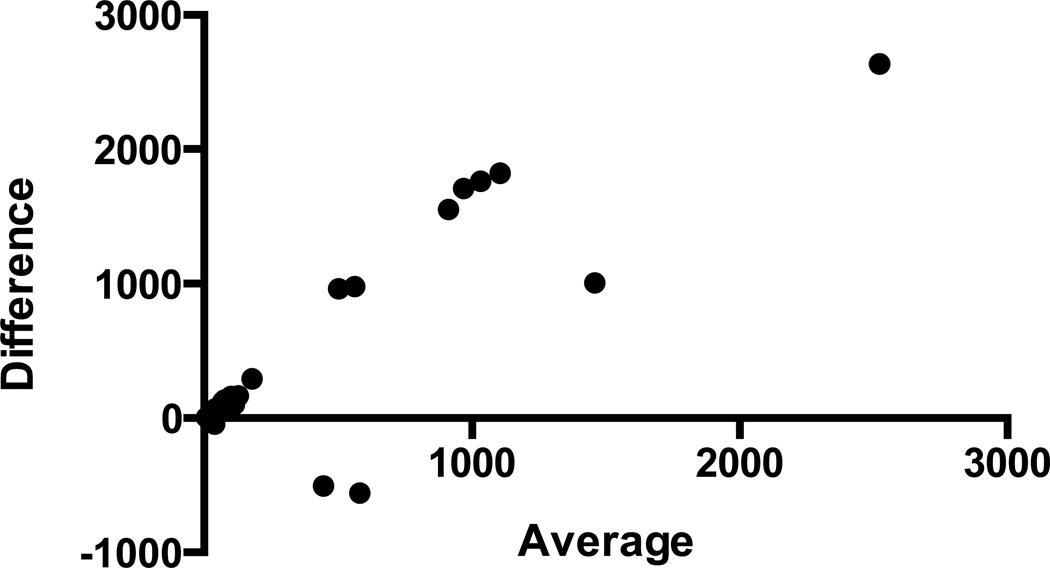
Figure 5.
Bland-Altman plot showing average values of cortisol derived from the ELISA and LCMS methods presented on the x-axis and absolute differences between the two methods presented on the y-axis. Scatterplot suggests a positive relationship between the absolute differences and average cortisol values (95% agreement limits −1075, +1991).

