
Figure 3.
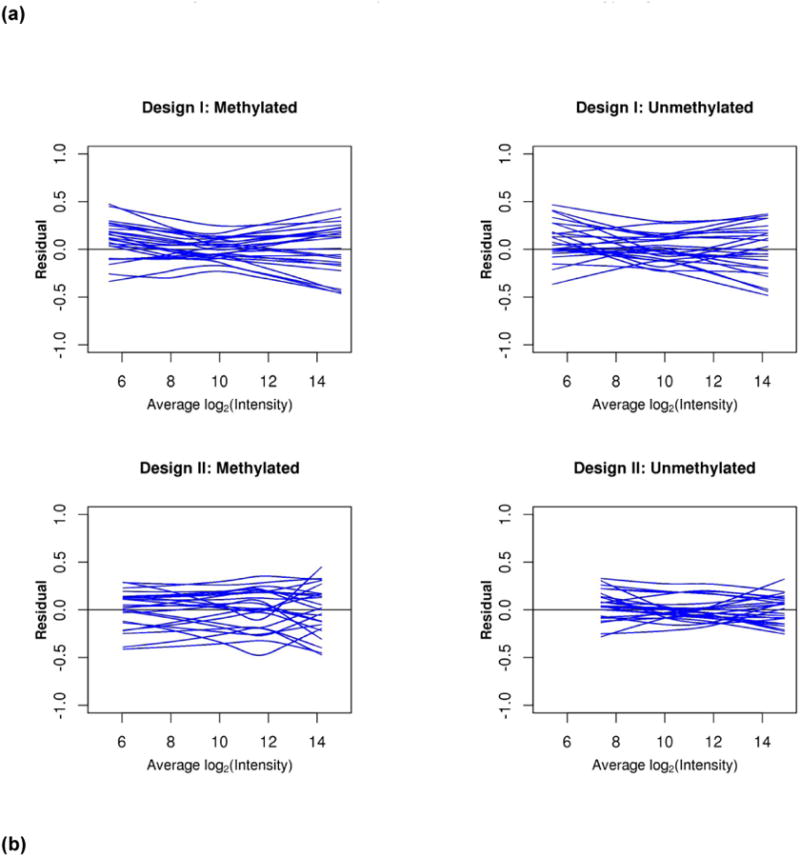
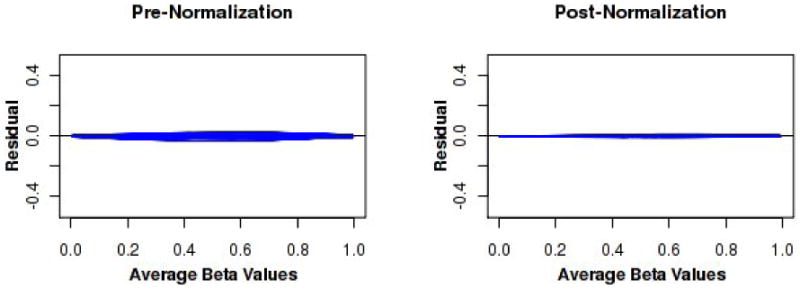
Over 450 PBMC specimens from healthy subjects aged 50-74 years old on were assayed on five bead array plates of the Illumina DNA methylation 450K assay. The assay utilizes two probe designs, each yielding an M and U intensity value (fluorescence intensity of methylated or un-methylated cells, respectively). These intensity values are mathematically combined to create an estimate of the percent methylation (β-value) in the specimen. (a) There is evidence of nonlinear between-specimen biases in the M and U expression intensities as demonstrated by these residual MVA plots. Each smoother represents one specimen. Nonlinearities are evident. (b) Between-specimen biases are near linear on the beta-value scale (left), are not large, and are essentially eliminated via this strategy (right).