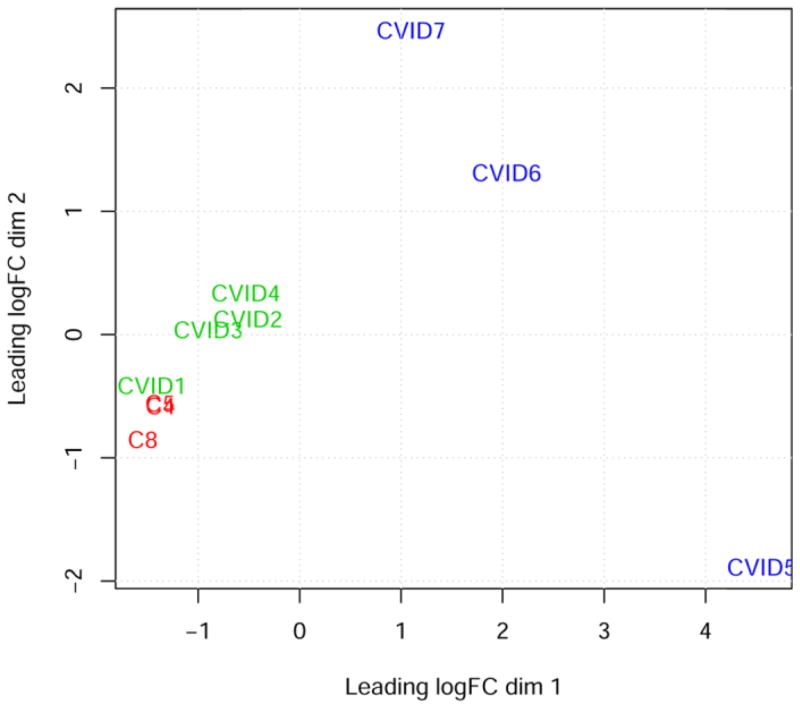
Figure 1. Multidimensional scaling plot of bone marrow transcriptomes.
Dimension 1 (x-axis) and dimension 2 (y-axis) separate samples based on expression of 15,508 genes and create 3 groups for statistical analysis: healthy controls (C4 and C5 overlap; and C8), CVID group 1 (patients #1–4), and CVID group 2 (patients #5–7).

