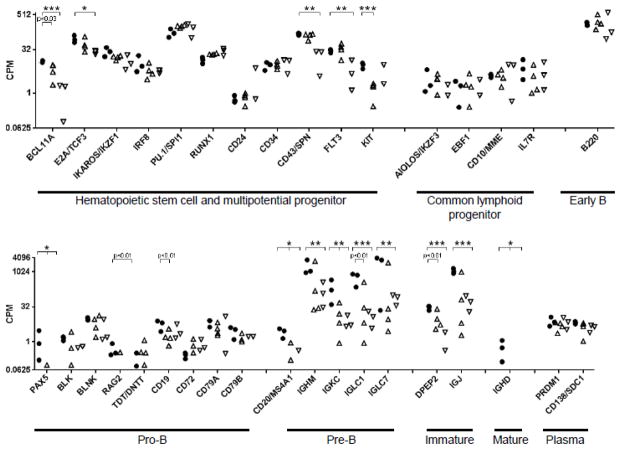
Figure 4. Expression of B lymphocyte-specific genes during differentiation from hematopoietic stem cells in the bone marrow of healthy control horses and equine CVID patients.
Gene expression is presented in counts per million reads (CPM) and plotted on the y-axis log scale for the genes listed on the x-axis. Genes are categorized by B lymphocyte differentiation stage. Significant differences in expression were determined by p-values corrected for false discovery rate (FDR). ‘*’ denotes FDR < 0.05, ‘**’ denotes FDR < 0.01, ‘***’ denotes FDR< 0.001.

