
Figure 8. Overview of B lymphocyte differentiation block in equine CVID patients based on transcriptome and epigenome data analyses.
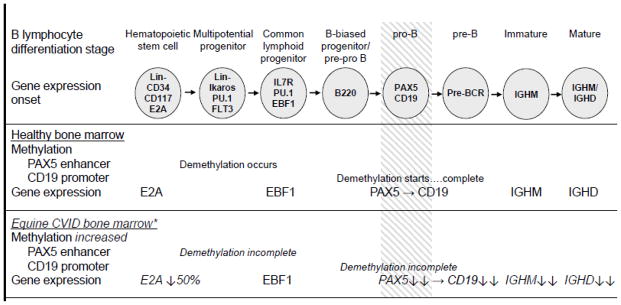
Stages of B lymphocyte differentiation are shown at the top. Changes in methylation and gene expression shown for healthy bone marrow yielding successful B lymphopoiesis (top panel) and equine CVID patient bone marrow with diminished B lymphopoiesis (bottom panel). The block defined in equine CVID B lymphopoiesis is indicated by shading. * Data shown are statistically different from control samples.