
Figure 1.
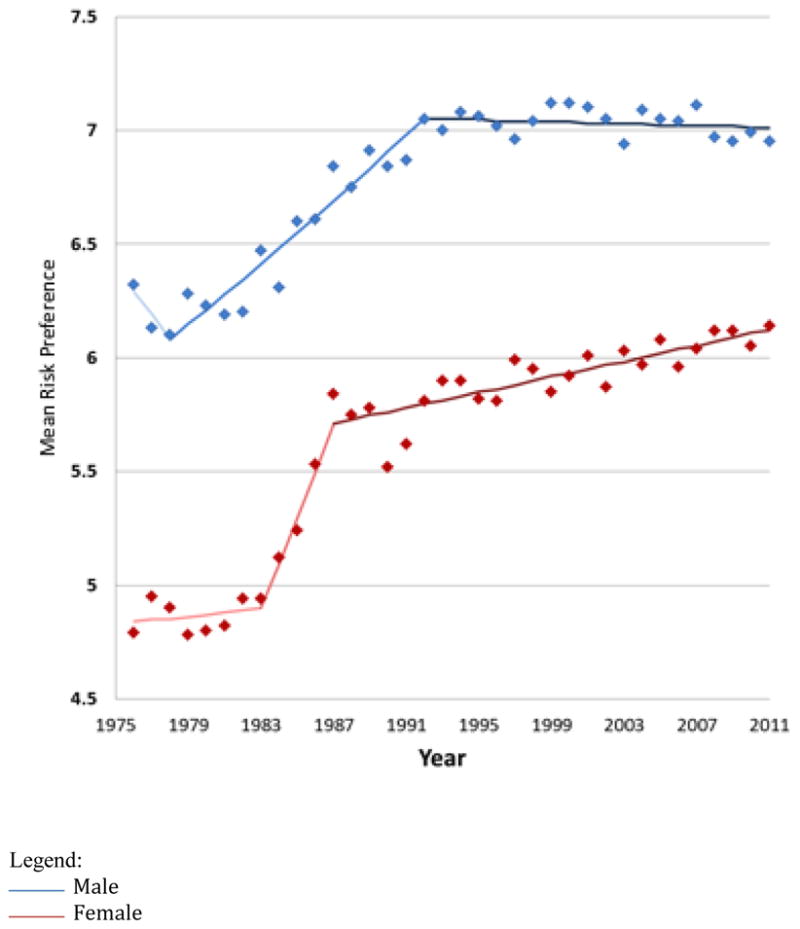
Mean risk preference (scale of 2 to 10) among high school 12th grade females (red) and males (blue) in the US from 1976 through 2011
*Best fitting model for mean risk preference across years included three slopes with two points of permutation. For males, points of permutation were 1978 (95% C.I. 1978–1984) and 1992 (95% C.I. 1988–1995). Slope 1: B=−0.02, Se=0.02, p=0.35; Slope 2: B=0.01, Se=0.0009, p<0.01; Slope 3: B=−0.0003, SE=0.0005 p=0.51. For females, points of permutation were 1983 (95% C.I. 1980–1985), and 1987 (95% C.I. 1985–1988). Slope 1: B=0.002, SE=0.003 p=0.57; Slope 2: B=0.04, SE=0.01, p=0.001; Slope 3: B=0.003, SE=0.0004, p<0.001.