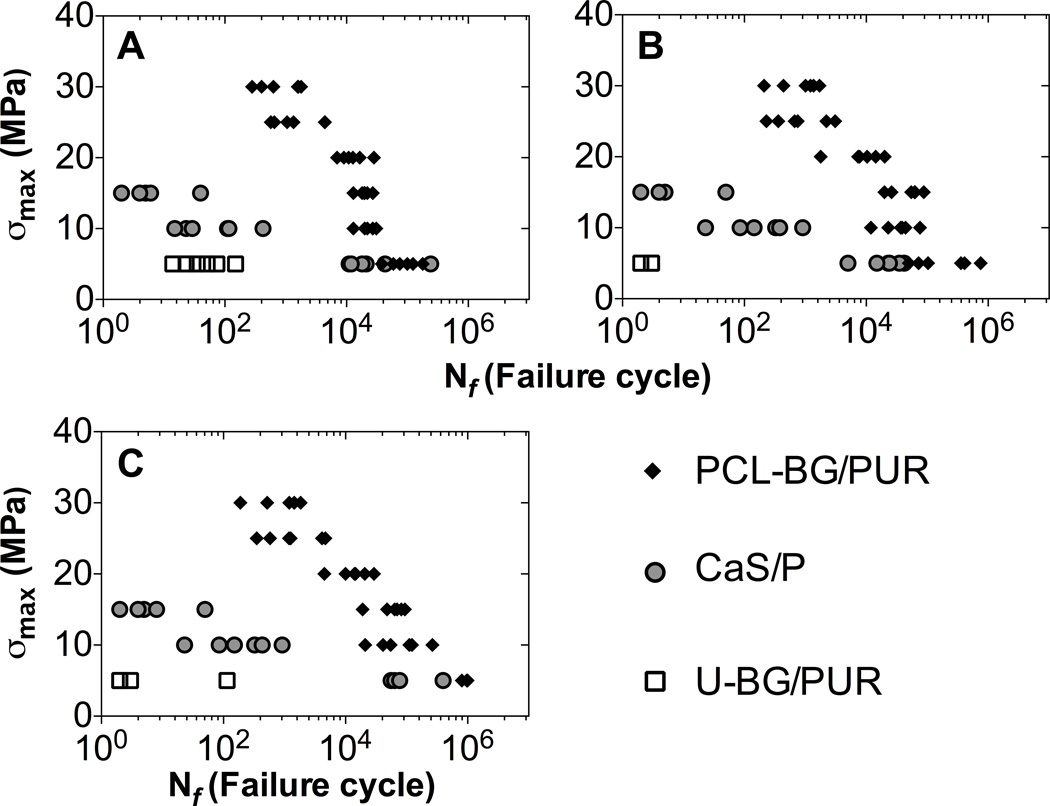
Figure 2.
Fatigue S-N plot of BG/PUR composites and CaS/P cement. Fatigue life (Nf) was determined based on three different definitions of failure cycle, as the first cycle with (A) 10% decrease in secant modulus (E) compared to average of first 10 segments, (B) 1% creep deformation (ck), and (C) 3% maximum displacement (dm). Data shown includes n=6 for each load/specimen group.

