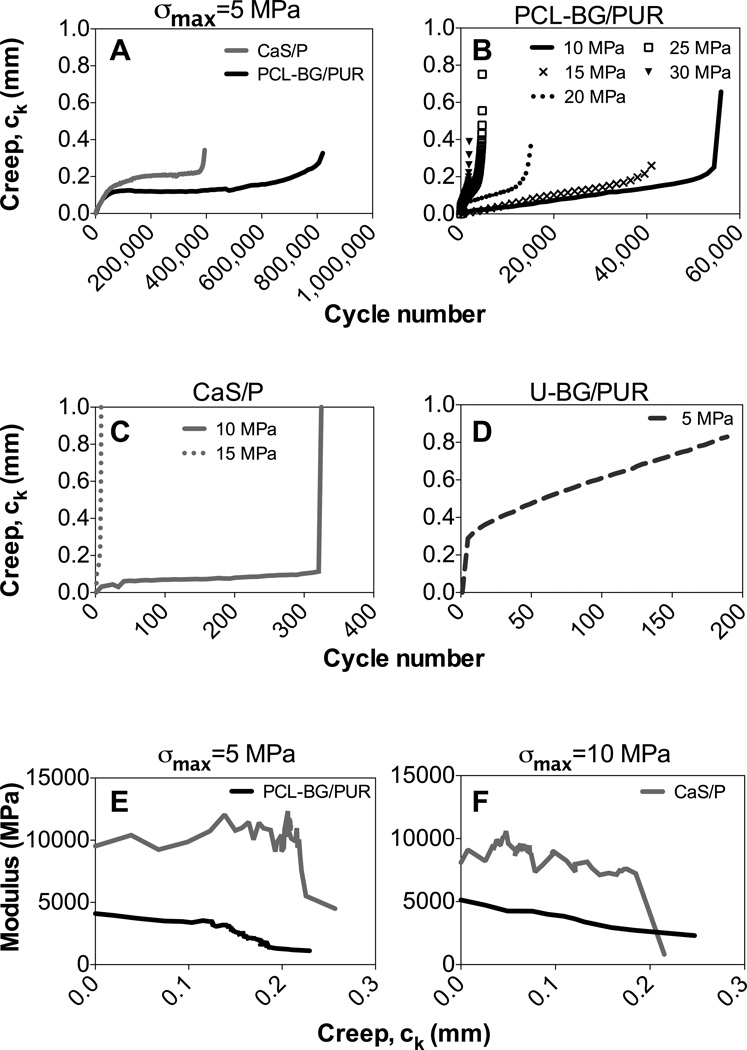
Figure 3.
Fatigue testing creep (ck) behavior vs. cycle number. Tested at maximum stress level (σmax) of (A) 5 MPa for PCL-BG/PUR composite and CaS/P cement, (B) 10-30MPa for PCL-BG/PUR, and (C) 10–15 MPa for CaS/P, and (D) 5 MPa for U-BG/PUR. Plots shown are median, representative data of each specimen group/load group (n=6). Note that differences between the groups/stress levels in the value of the final creep data point plotted were due to interval span of cyclic data collected. Modulus (E) vs. creep (ck) for PCL-BG/PUR and CaS/P at σmax= (E) 5 MPa and (F) 10 MPa.

