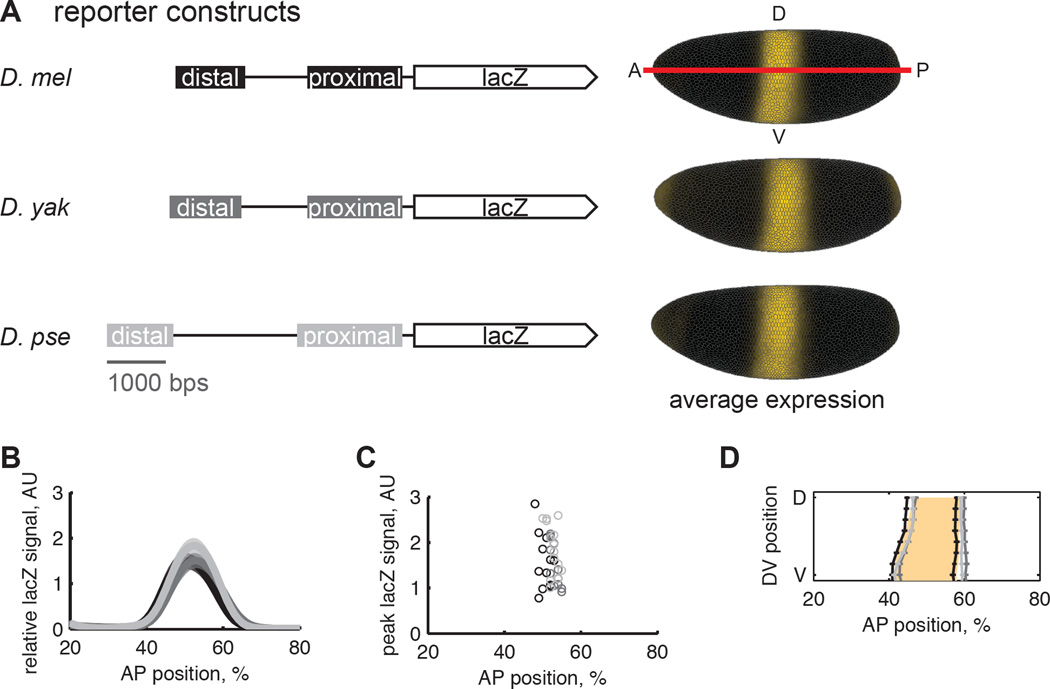
Figure 1.
The pair of shadow enhancers from D. mel, D. yak, and D. pse drive similar levels of gene expression. (A) We created transgenic D. mel lines that contain lacZ reporters for the Kr distal and proximal enhancers with endogenous intervening sequence from D. mel, D. yak, and D. pse. All reporter constructs in this study were integrated into the same site in the genome. The “virtual” embryos show the average lacZ expression pattern in yellow and are oriented with anterior left, posterior right, dorsal up and ventral down. We used in situ hybridization with a co-stain to detect lacZ expression. We find that the spatial pattern and level of lacZ expression driven by these three constructs are nearly identical (B, C, D). (B) Average lacZ signal from each reporter line is plotted as a function of anterior-posterior position along the lateral side of the embryo, with shaded regions showing the standard error of the mean. D. mel is in black; D. yak in dark gray, and D. pse in light gray. (C)The position and magnitude of peak lacZ expression is plotted for individual embryos. Using a rank-sum test with a Bonferroni multiple comparison correction, we find the median peak expression levels between to the three reporter lines is not statistically different, p-value>0.3. (D) The position of the lacZ expression boundaries is plotted with the standard error of the mean. The anterior expression boundary does not significantly vary between lines, but the posterior boundary is shifted to the anterior in the D. mel reporter line by 1% of the anterior-posterior axis, about 1 cell width. The shaded orange region is the endogenous D. mel Kr expression pattern. The D. mel reporter matches endogenous expression to within a cell width, indicating that most of Kr’s spatial regulatory information is captured by the reporter.

