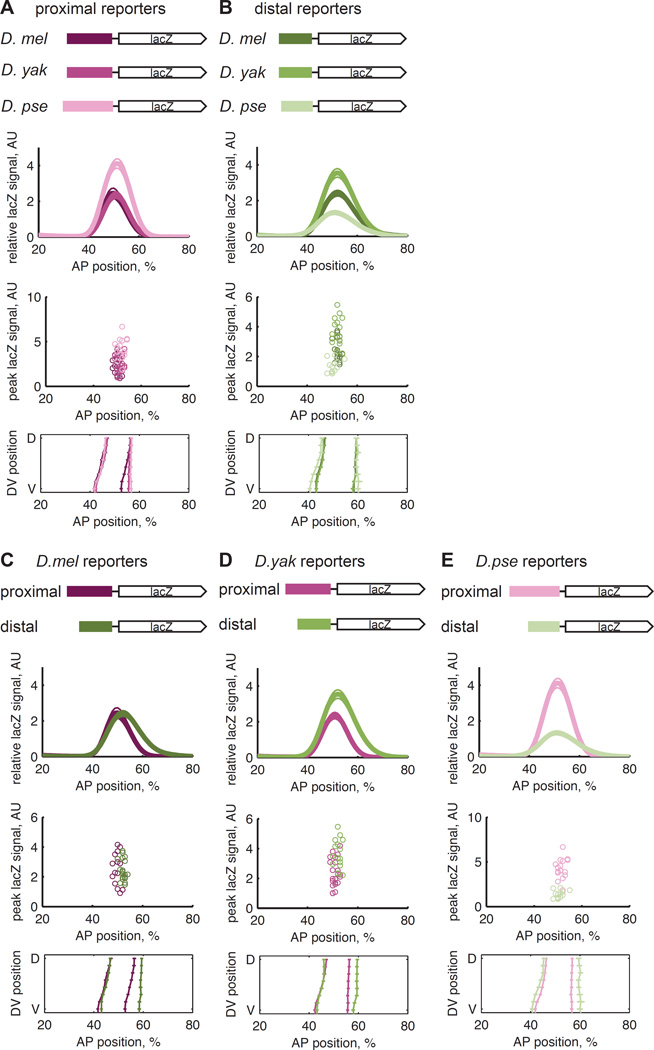
Figure 2.
The spatial expression patterns and levels of mRNA driven by individual Kr enhancers vary between species. We measured the expression driven by six additional reporter lines containing the proximal and distal enhancers from D. mel, D. yak, and D. pse. (A) The proximal enhancers do not drive conserved expression patterns or levels. The median peak expression levels between the D. mel and D. pse and the D. yak and D. pse lines are statistically different (rank sum test, p-values <= 0.002). (B) The distal enhancers do not drive conserved expression patterns or levels (rank sum test of median peak levels, p-values <= 0.002). In (C), (D), and (E), the data from (A) and (B) is represented to compare the enhancers from each species. The D. mel enhancers drive similar levels of expression (rank sum, p-value = 0.81) but different patterns, while the D. yak and D. pse enhancers drive different patterns and levels of mRNA (rank sum, p-values = 0.0017 and 8e-6, respectively).

