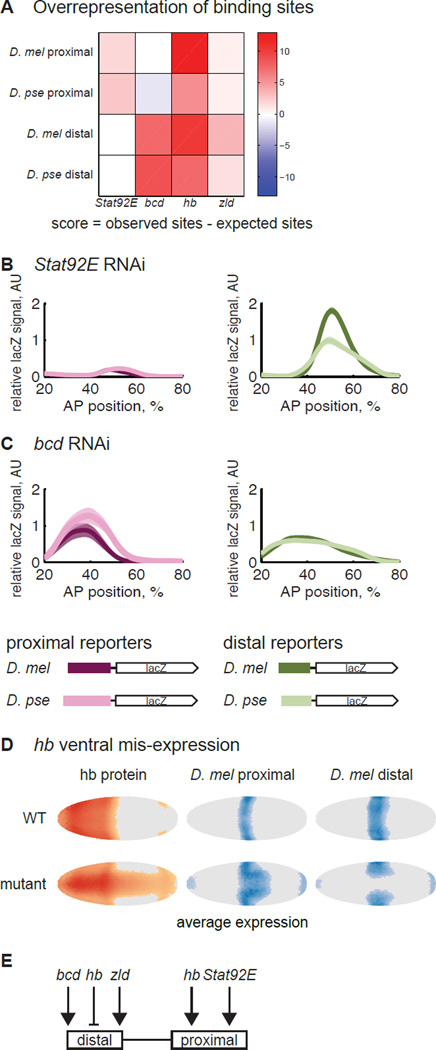
Figure 4.
The proximal and distal enhancers are not activated by the same transcription factors. (A) We compared the observed number of binding sites for Kr’s known activators, Stat92E, bcd, hb and zld, to a background distribution of binding sites, derived from the DNAse-sensitive regions of the genome at the blastoderm stage. The p-values associated with these scores are in Figure S1. The analysis suggests that the proximal enhancers are controlled by Stat92E and hb and distal enhancers by bcd, hb and zld. To verify the prediction, we crossed the single enhancer constructs into Stat92E (B) and bcd RNAi lines (C) and measured lacZ expression in these RNAi embryos. As expected, the proximal enhancers drive weak expression in the Stat92E RNAi embryos, and the distal enhancers drive weak expression in the bcd RNAi embryos. In bcd RNAi, the proximal enhancers are also lowly-expressed; this is likely due to indirect effects of bcd RNAi on hb levels (Struhl et al., 1989). The expression pattern is also shifted to the anterior and widened, as has been previously observed with the Kr endogenous pattern in bcd RNAi embryos (Staller et al., 2015a). We cannot compare the expression levels in RNAi embryos to the WT embryos in Figure 2 because we do not know the effect of bcd and Stat92E RNAi on our co-stain. But the unequal expression levels of D. mel enhancers in bcd and Stat92E RNAi as compared to the equal levels in WT demonstrates the differential sensitivity of these enhancers to the perturbation. (D) To test each enhancer’s hb sensitivity, we mis-expressed it in the ventral part of the embryo. In the left column, we show the average pattern of hb protein expression in WT and hb mis-expression embryos at mid-blastoderm stage, taken from (Staller et al., 2015b). We thresholded cells with expression levels greater than the mode + 0.5 standard deviation as “on” and colored the rest of the cells gray as “off”. Deeper colors indicate higher expression. The middle and right columns show the average lacZ expression pattern in each genetic background. The data were thresholded at the mode + 1 standard deviation. The expansion of the proximal enhancer’s pattern is consistent with hb activation, while the retreat of the distal enhancer’s pattern suggests repression by hb. The expression in the poles of the embryos is an unused hkb co-stain. (E) Our evidence suggests that the distal enhancer is activated by bcd and zld and repressed by hb. The proximal enhancer is activated by Stat92E and hb.

