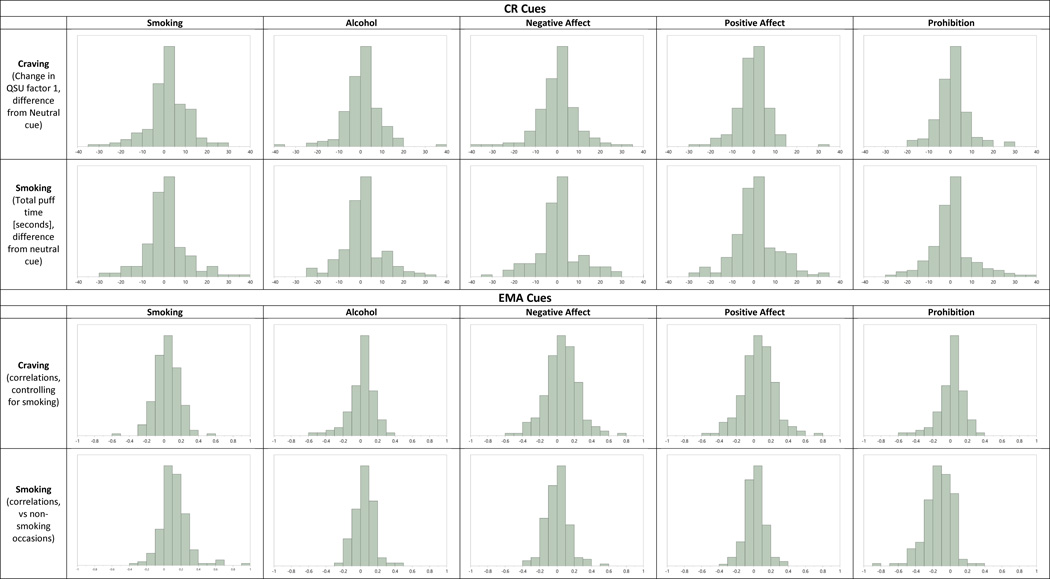
Figure 1.
Distribution of smoker responses to cues, by method and cue. CR craving data (Shiffman et al, 2013a) are graphed as the difference between each cue and the neutral cue in post-cue vs pre-cue QSU Appetitive Craving, which was assessed on a 49-point scale. (Distress-relief craving, not shown, showed very similar distributions.) CR smoking data are graphed as the difference in total puff time (with no smoking represented as zero puff time) following each cue versus the neutral cue. EMA data (Shiffman et al., 2014b) are graphed as individual subject correlations between cues and rated contemporaneous EMA-reported craving (on a 0–100 scale, adjusting for whether the subject was smoking or not) or smoking (vs. not smoking). Negative and Positive Affect were represented by factor scores on composite affect scales; other cues were assessed as present or absent, based on EMA reports.

