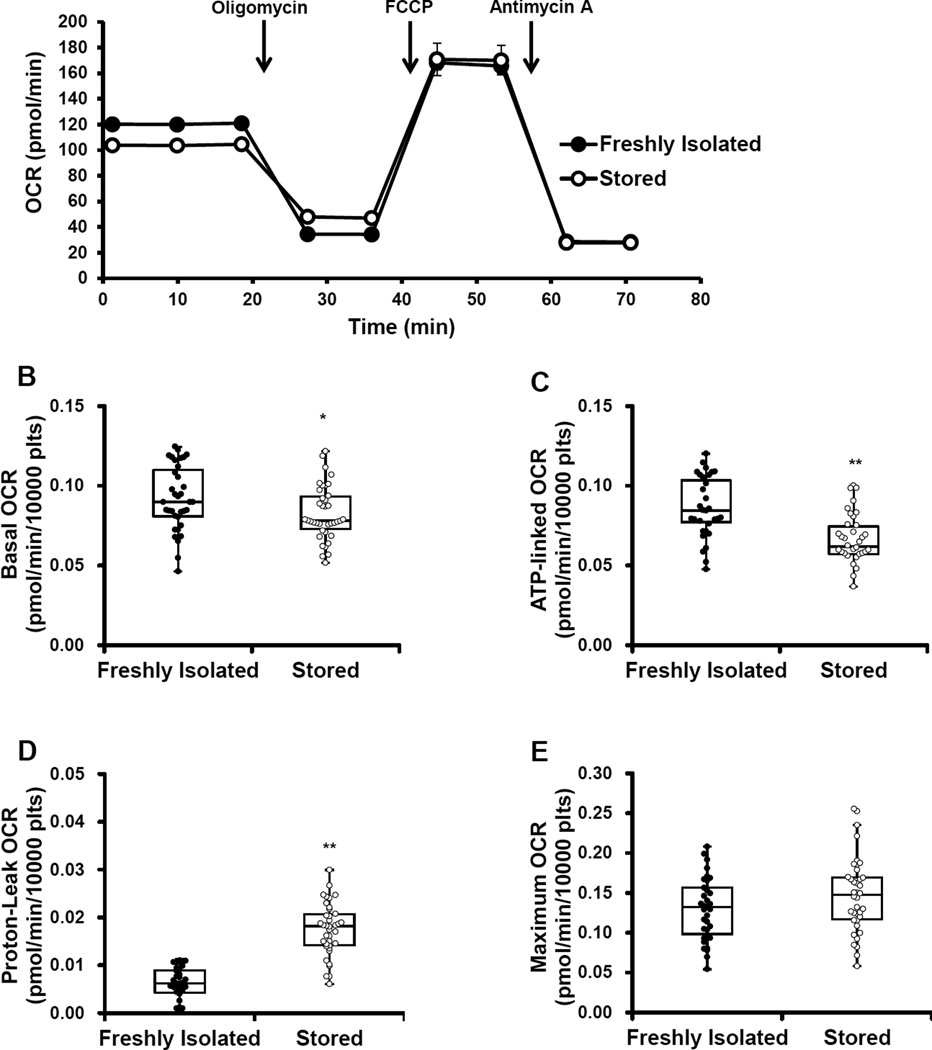
Figure 2. Mitochondrial function of freshly isolated and stored platelets.
Freshly isolated and stored platelets (10×106/well) were plated on Cell-Tak coated plates and mitochondrial stress test was performed by establishing basal OCR followed by sequential injection of 1 µg/ml oligomycin, 0.6 µM FCCP and 10 µM antimycin A. (A) Representative OCR traces of mitochondrial stress test. Indices of mitochondrial function – (B) Basal, (C) ATP-linked (AL), (D) Proton leak (Pl), (E) Maximal (Max), (F) Reserve capacity (RC), (G) Non-mitochondrial (NM) OCR and (H) BHI [(ALxRC)/(PLxNM)] were calculated. The indices are represented in a box plot with lower 25th percentile, median, upper 75th percentile, and whiskers drawn at 1.5 × interquartile range. n = 35 individual donors for the freshly isolated and n = 38 individual bags for the stored. *p<0.05, **p <0.01, different from freshly isolated.


