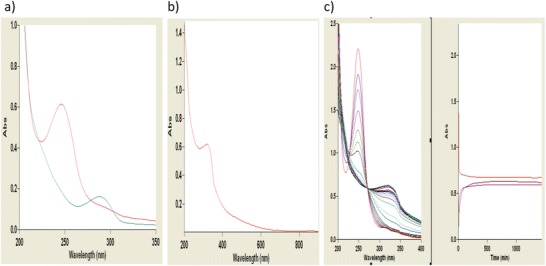
Fig. 4.

Spectral scans of solutions of HGA, pigment and a urine from a patient with AKU effect of pH and time. All procedures followed were in accordance with the ethical standards of the local hospital ethics committee. Informed consent was obtained from patient(s) included in the study. (a) Pre- and post-alkalinisation, i.e. to pH 10 (1 pt10 M/L NaOH and 50 pts urine), of untreated AKU urine (approximately 20 mmol/L HGA): blue line pre and red line post. (b) HGA solution10 mmol/L scanned 24 h after alkalinisation with ammonia (20 mM/L final concentration). (c) A kinetic study of the alkalinisation of an HGA solution over 24 h absorbances at 250 nm (BQA=red), 290 nm (HGA=brown) and 318 nm (purple). Showing the rapid disappearance of BZQ peak 250 nm and slower loss of peak at 316. Scanning urine or synthetic pyomelanin at pH’s 10.0, 7.0 and or 2.5 shows a similar profile with no definite peaks as in Fig. 4a (blue line) and b. However, for solution at pH 10.0 solutions, the peak at 250 nm was much less and was relatively stable at pH 6.0. Solutions/samples were diluted usually 1 pt to 100 pts of diluent deionised water or buffer solution and scanned with Cary UV–vis scanning spectrometer (Agilent, UK) giving a full scan (200–800 nm) every 1 min
