
Fig. 7.
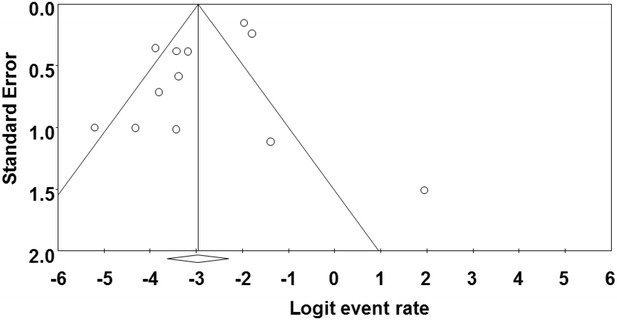
Funnel plot of prevalence of Cronobacter spp. in animal originated food samples. Solid vertical line represents the summary prevalence rate derived from fixed-effect meta-analysis while the diagonal lines represent 95 % confidence interval
Official websites use .gov
A
.gov website belongs to an official
government organization in the United States.
Secure .gov websites use HTTPS
A lock (
) or https:// means you've safely
connected to the .gov website. Share sensitive
information only on official, secure websites.
Funnel plot of prevalence of Cronobacter spp. in animal originated food samples. Solid vertical line represents the summary prevalence rate derived from fixed-effect meta-analysis while the diagonal lines represent 95 % confidence interval