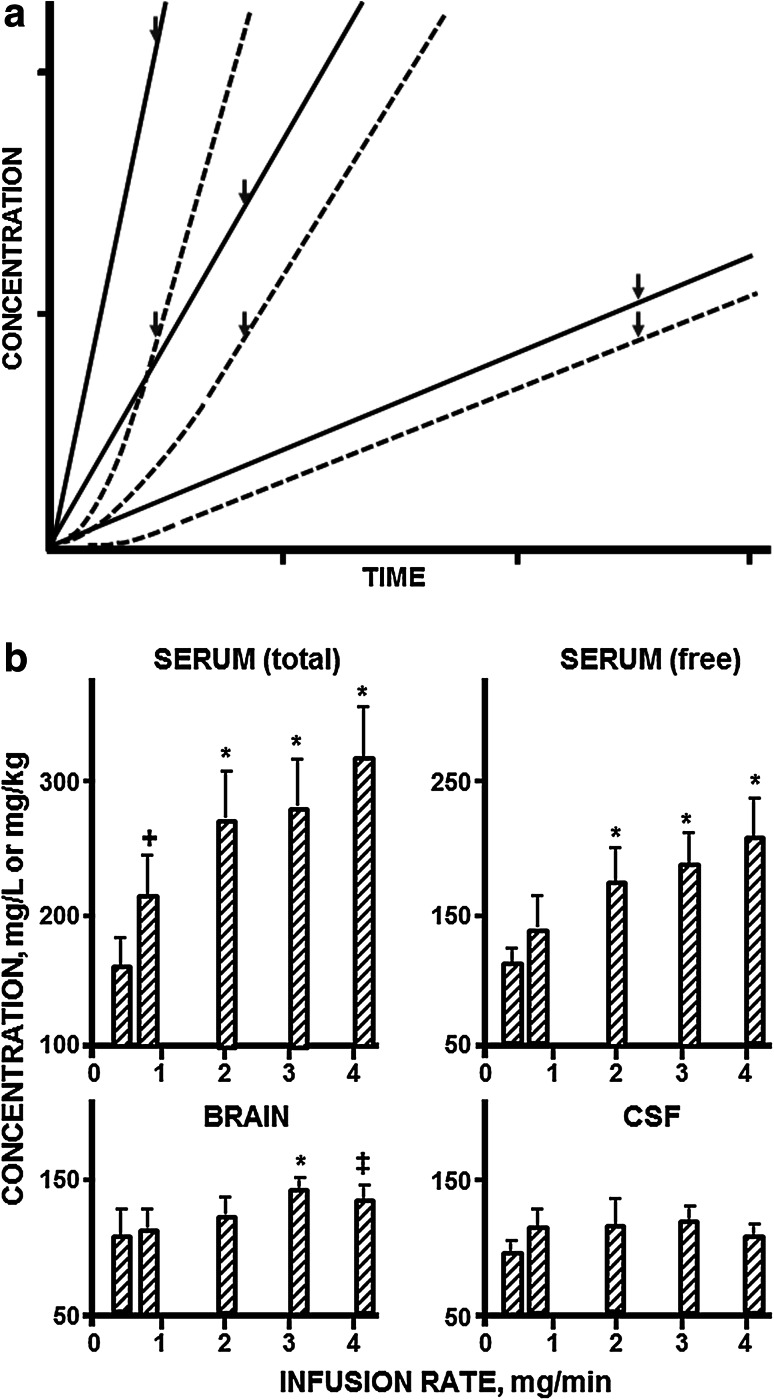
Fig. 1.
a Schematic representation of drug concentration versus time profiles at three different infusion rates in the plasma (continuous lines) and at the site of action (dashed lines). The time of onset of a pharmacologic effect is indicated by arrows. The representation is a simulation of a two-compartment system with a drug clearance of 0.029 l/h, a terminal drug half-life of 24 h and infusion rates of 0.42, 2.5 and 4.2 mg/min. It should be noted that the drug concentration in plasma at onset of effect decreases with decreasing infusion rate. b Effect of infusion rate on the concentration of phenobarbital in serum (total and unbound drug, respectively), brain and CSF of female rats at the onset of loss of righting reflex. Results are the mean of five to nine animals per group, with the vertical line indicating 1 SD. Infusion rate had a significant effect (p < 0.001 by one-way analysis of variance) on drug concentrations in serum and brain but not on concentrations in CSF. The symbols above the vertical bars indicate significant differences from the results produced by the lowest infusion rate (*p < 0.002; ‡p < 0.01; +p < 0.05; Newman-Keuls test). Reproduced from Danhof and Levy 1984 [5]

