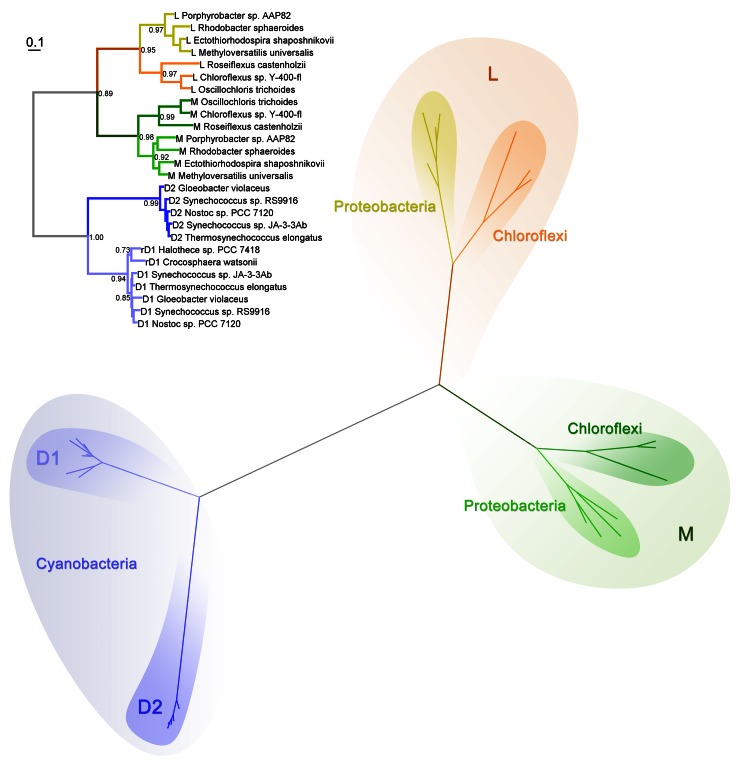
Fig. 3.
Maximum likelihood phylogenetic tree of Type II reaction center subunits. At the top, the tree is shown as a rectangular phylogram, and the same tree is displayed at the bottom as a radial phylogram to highlight the different clades. Sequences were aligned with ClustalX 2.1 (Larkin et al. 2007), and homologous positions were confirmed by overlapping the crystal structures of B. viridis (2PRC) and T. vulcanus (3ARC). The tree was calculated using PhyML 3.1 (Guindon et al. 2010), using the LG model of amino acid substitution and four substitution rate categories. The branch support was calculated with the Approximate Likelihood-Ratio Test (Anisimova and Gascuel 2006). The equilibrium frequencies, proportion of invariable sites, and the gamma shape parameter were set to be calculated by the program. Sequence alignments are available on request

