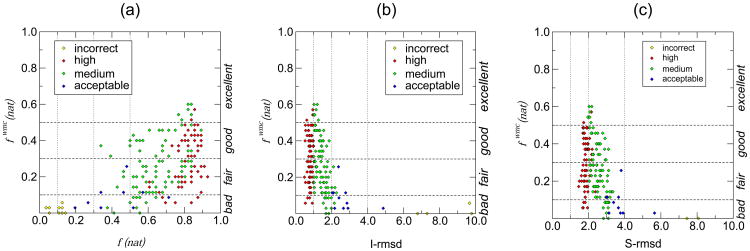
Figure 3.
Relationships between fwmc(nat) and various measures for evaluating the quality of docking models in the regular CAPRI assessment.
(a) Scatter plot illustrating the relationship between fwmc(nat) (vertical axis) and f(nat), the fraction of residue-residue contacts recalled in individual submitted models of the colicin E2 DNase – Im2 complex T47 (horizontal axis). Horizontal dashed lines are used to indicate fwmc(nat) values separating bad, fair, good, and excellent or outstanding predictions (see text). Vertical dotted lines indicate the f(nat) values that separate high / medium / acceptable quality docking models in the classical CAPRI assessment. Individual data points in the figures are color-coded following final evaluation classification: high quality: red; medium quality: green; acceptable: blue; incorrect: yellow.
(b) Scatter plot illustrating the relationship of fwmc(nat) and I_rmsd(Å), the root mean square deviation of backbone atoms of interface residues, in submitted models of T47. All other details are as in (a).
(c) Scatter plot illustrating the relationship of fwmc(nat) and S_rmsd(Å), the root mean square deviation of the side chain atoms of interface residues measured after optimal superimposition of the backbone of these residues in the submitted and target structures, for T47. All other details are as in (a).

